


Treasury Bonds ETF Inverse Trend to Stock Market Indices
Interest-Rates / US Bonds Oct 14, 2008 - 02:17 PM GMTBy: Mike_Paulenoff

 To some degree, the TLTs (Lehman 20 Yr T-bond, ETF) trades inversely to the equity indices like the SPYs (for instance); however, my sense is the recent upside explosion in the stock averages and the recent plunge in TLT prices have "corrected" and defused the bulk of that relationship, which if accurate, means that a new relationship is forming based less on flight-to-safety and more on the still-challenging (to put it mildly) economic fundamentals that will not be corrected any time soon.
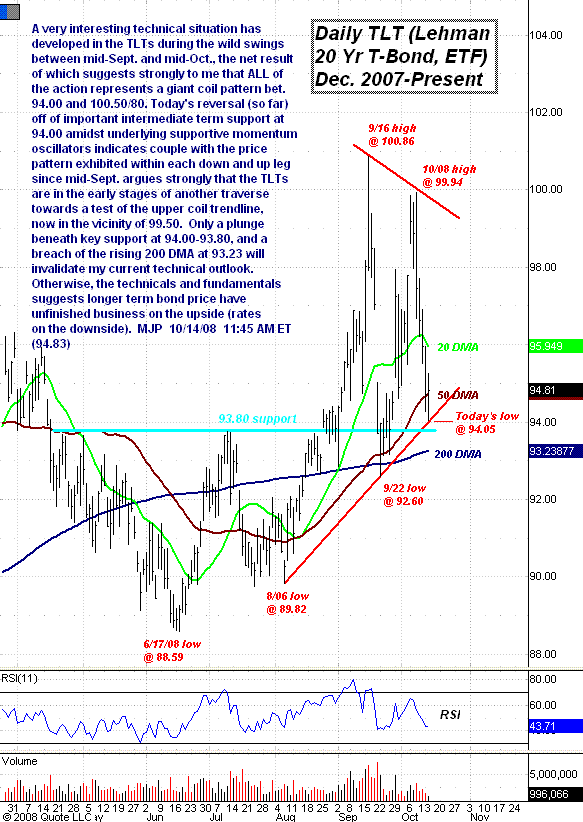
As the daily chart indicates, a very interesting technical situation has developed in the TLTs during the wild swings between mid-September and mid-October, the net result of which suggests strongly to me that ALL of the action represents a giant coil pattern between 94.00 and 100.50/80. Today's reversal (so far) off of important intermediate-term support at 94.00 amidst underlying supportive momentum oscillators, coupled with the price pattern exhibited within each down and up leg since mid-Sept, argues strongly that the TLTs are in the early stages of another traverse towards a test of the upper coil trendline, now in the vicinity of 99.50. Only a plunge beneath key support at 94.00-93.80 and a breach of the rising 200 DMA at 93.23 will invalidate my current technical outlook. Otherwise, the technicals and fundamentals suggest longer-term bond prices have unfinished business on the upside (rates on the downside).
Sign up for a free 15-day trial to Mike's ETF Trading Diary today.
By Mike Paulenoff
Mike Paulenoff is author of the MPTrader.com (www.mptrader.com) , a real-time diary of Mike Paulenoff's trading ideas and technical chart analysis of Exchange Traded Funds (ETFs) that track equity indices, metals, energy commodities, currencies, Treasuries, and other markets. It is for traders with a 3-30 day time horizon, who use the service for guidance on both specific trades as well as general market direction
© 2002-2008 MPTrader.com, an AdviceTrade publication. All rights reserved. Any publication, distribution, retransmission or reproduction of information or data contained on this Web site without written consent from MPTrader is prohibited. See our disclaimer.
Mike Paulenoff Archive |
© 2005-2022 http://www.MarketOracle.co.uk - The Market Oracle is a FREE Daily Financial Markets Analysis & Forecasting online publication.