


How To Spot The End Of An Excess Market Trend Phase
InvestorEducation / Learn to Trade Nov 27, 2020 - 04:46 PM GMTBy: Chris_Vermeulen

If you have been following my team’s research posts recently, we have highlighted some interesting new research related to Appreciation/Depreciation phases in the US stock market and how that relates to Gold. Today we will explore another method of identifying the different phases of market trends that appears to show very clear Appreciation/Depreciation phases and extended end-phase blow-off tops and bottoms.
My research team and I believe the current rally in the US stock markets represents an end-phase blow-off top after a 9.5-year Appreciation phase that began in mid-2009. We believe it is very important for traders to understand these larger Appreciation/Depreciation cycles and how the Blow-Off end phases often create extreme volatility and price rotation.
Below, we are using a custom EURUSD/JPYUSD index divided by GOLD as the base Candlestick chart and have applied the real Gold price levels on the chart for visual reference. Near the bottom of the chart, we are showing the RSI indicator, the TSICCI indicator, and the RSI + MFI Indicator that helps to highlight the broad market trends and cycle phases. We want you to pay attention to the GREEN and RED arrows we’ve drawn on this chart showing the Appreciation/Depreciation phases of Gold and the broader US stock markets in EUR/JPY currency form. This method of charting these phases takes a bit of patience and understanding. We are looking for correlations to US stock market trends in relation to precious metals and we must consider the end-phase process.
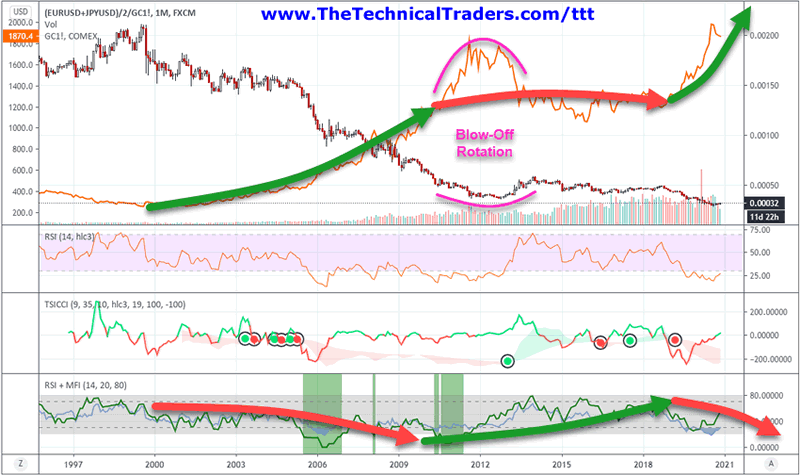
The end-phase process after any appreciation or depreciation phase often includes a very volatile “blow-off” period where trends continue beyond the end of the actual price phase. This happens because the momentum of the previous price move has yet to realize the transitional shift in underlying appreciation/depreciation factors. Traders still want the rally in the stock market or metals to continue, so they chase after the excess phase rally until the momentum of the move fails.
These end-phase excess rallies can be quite exciting and volatile but often end in a certain type of setup. We believe it is important for all traders and investors to understand the end-phase setup and how it translates into opportunities for skilled traders.
LEARN THE COMPONENTS OF AN EXCESS PHASE PEAK/BREAKDOWN
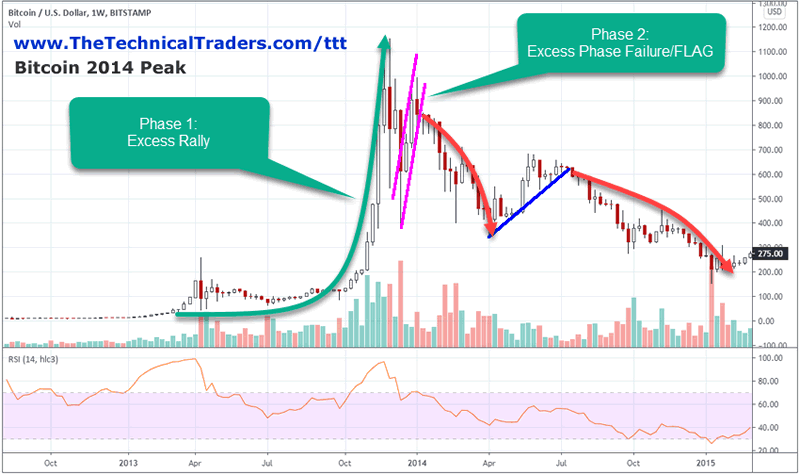
First, the Phase 1 Excess Rally must take place. This is usually an impressive upside price move that may last far longer than many people expect. For example, the 2014 peak in Bitcoin rallied from near $100 to over $1100 (over 1000%), then stalled.
The Second Phase of the Excess Blow-Off peak is the retracement of price followed by a FLAG/Pennant trend that appears to be a resumption of the original trend. This is important from a psychological perspective because it provides further technical price data that the excess rally phase has failed.
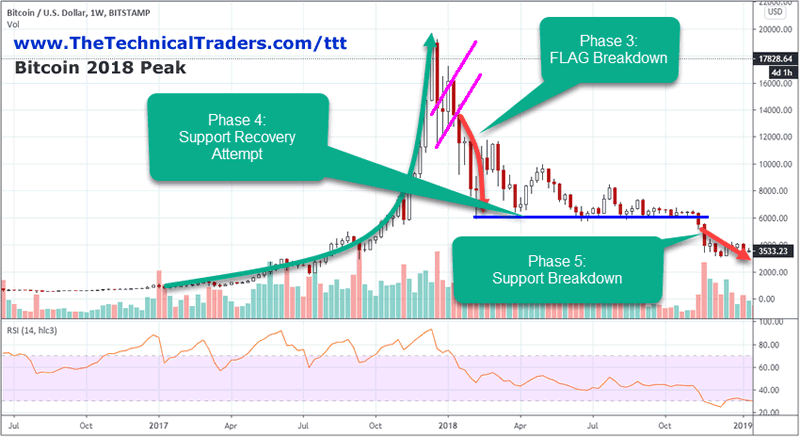
Looking at Phases 3, 4, and 5 on the chart below, we can see the Third Phase is the breakdown of the FLAG formation. When the FLAG formation fails, price usually falls to a new lower support level which sets up the final “exhaustion rally” before stronger selling pressure continues. This is usually a very good trend for short traders. The FLAG setup usually gives traders time to setup Put Options or setup short positions waiting for the breakdown of the FLAG setup.
Before you continue, be sure to opt-in to our free market trend signals before closing this page, so you don’t miss our next special report!
The Fourth Phase is the identification/setup of the Support/Recovery Attempt. After the FLAG breakdown initiates, price starts to actively seek out fair valuation levels below the Excess Phase peak and the recent FLAG pattern lows. This process usually attempts to identify a near term support level that begins to act as a Price Floor for quite some time.
Lastly, the Phase Five Breakdown, as the momentum of the past rally fades and traders resign themselves to the fact that the excitement of the Excess Phase rally has ended. At this point, price usually continues to consolidate near the Phase Four support level before finally breaking downward into the extended downside/bearish trend.
As we’ve stated near the top of this research post, our research team believes the current US stock market appreciation phase ended in mid-2018 and that we are nearly 2.5 years into an Excess Phase (blow-off) topping formation. We believe the next phase of the US market trend will be something similar to what we are showing you in these examples. It is important for all traders and investors to recognize these late stage volatile price setups, particularly ones that are pushed to extreme limits because of Central Bank and US Fed interventions.
In Part II of this research article, we’ll share more examples of late Excess Phase peaks and breakdowns as well as share more insight related to the current market conditions. If our research is accurate, we are about to enter a very exciting phase of the market where big price rotation and wild trends will continue for the next 4 to 5+ years before a new US stock market appreciation phase begins again. We can help you find and identify great trading opportunities so visit www.TheTechnicalTraders.com to learn about my exciting ”Best Asset Now” strategy and indicators. You can also sign up for my daily pre-market video reports that walks you through the charts of all the major asset classes every morning.
Chris Vermeulen
www.TheTechnicalTraders.com
Chris Vermeulen has been involved in the markets since 1997 and is the founder of Technical Traders Ltd. He is an internationally recognized technical analyst, trader, and is the author of the book: 7 Steps to Win With Logic
Through years of research, trading and helping individual traders around the world. He learned that many traders have great trading ideas, but they lack one thing, they struggle to execute trades in a systematic way for consistent results. Chris helps educate traders with a three-hour video course that can change your trading results for the better.
His mission is to help his clients boost their trading performance while reducing market exposure and portfolio volatility.
He is a regular speaker on HoweStreet.com, and the FinancialSurvivorNetwork radio shows. Chris was also featured on the cover of AmalgaTrader Magazine, and contributes articles to several leading financial hubs like MarketOracle.co.uk
Disclaimer: Nothing in this report should be construed as a solicitation to buy or sell any securities mentioned. Technical Traders Ltd., its owners and the author of this report are not registered broker-dealers or financial advisors. Before investing in any securities, you should consult with your financial advisor and a registered broker-dealer. Never make an investment based solely on what you read in an online or printed report, including this report, especially if the investment involves a small, thinly-traded company that isn’t well known. Technical Traders Ltd. and the author of this report has been paid by Cardiff Energy Corp. In addition, the author owns shares of Cardiff Energy Corp. and would also benefit from volume and price appreciation of its stock. The information provided here within should not be construed as a financial analysis but rather as an advertisement. The author’s views and opinions regarding the companies featured in reports are his own views and are based on information that he has researched independently and has received, which the author assumes to be reliable. Technical Traders Ltd. and the author of this report do not guarantee the accuracy, completeness, or usefulness of any content of this report, nor its fitness for any particular purpose. Lastly, the author does not guarantee that any of the companies mentioned in the reports will perform as expected, and any comparisons made to other companies may not be valid or come into effect.
Chris Vermeulen Archive |
© 2005-2022 http://www.MarketOracle.co.uk - The Market Oracle is a FREE Daily Financial Markets Analysis & Forecasting online publication.