


Stock Market Buy and Hold Strategy Smashed
Stock-Markets / Investing Oct 16, 2008 - 08:06 AM GMT

 Have you heard these statements from your financial planner, mutual fund advisor, or stock broker?
- In the long term the market rises 8% per year.
- Investors cannot time the market. The best strategy for investing is to buy and hold for the long term.
How many decades does the "buy and hold" investor have to wait to get their 8% per year return from the Dow Jones Industrial Average?
This is what a chart of the Dow Jones looks like for nearly the past nine years.
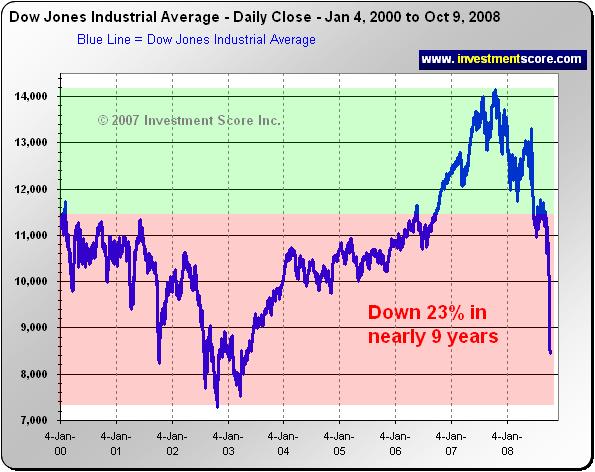
How many years (or decades) of holding an investment is considered "long term"? The above chart illustrates that the "buy and hold investor" that entered the market in the year 2000 would have made a negative 23% total return on their money by October 9, 2008. Keep in mind that this return does not factor inflation into the equation. Since the year 2000 how much more does it cost to buy food, get an education, heat your home, get medical treatment, buy gas for your car etc.? The "buy and hold" investor has done significantly worse when factoring in the effects of inflation into their investment returns.
When comparing the Dow Jones directly to another asset such as gold, we bypass the distortion of the fluctuating US dollar measuring stick. The following chart illustrates the performance of the Dow Jones when priced in gold.
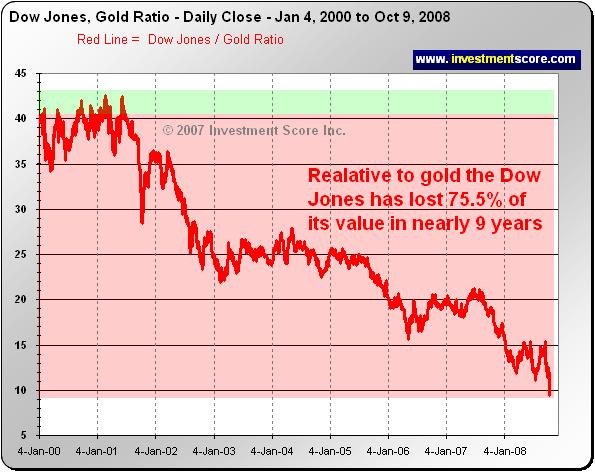
In this chart we can see how much the Dow Jones has fallen in value relative to gold, and conversely how much gold has risen relative to the Dow Jones. In the year 2000 it took roughly 40 ounces of gold to buy one share of the Dow Jones industrial average. Today it takes roughly 10 ounces of gold to buy one share of the Dow Jones. In other words, relative to gold, the Dow Jones has lost roughly 75.5% of its value.
We are not suggesting that the average investor try to time the market on a day to day basis. Instead we are trying to illustrate why we attempt to time the "big picture" of large shifts of capital from overvalued asset classes to undervalued asset classes. We believe that timing these large, multi decade cycles may be the most important investing strategy an investor could follow. These long term "mega trends" are where significant profit is made as the rising tide of the bull market raises all boats.
A good example of these shifts of capital is seen during the 1960's to 1980 when investors fled paper assets such as stocks and bonds in favor of hard assets such as gold and silver, but because markets are cyclical and not linear that same money flew out of hard assets and into paper assets from 1980 to 2000. In our opinion the large cyclical transfer from paper assets to hard assets started once again in 2000 until present. We believe investors are losing faith in paper assets and are once again in the process of transferring their money into the security of hard assets.
Markets are cyclical and one day the sun will shine brightly on financial stocks, technology stocks and the like again. But in our opinion this recent drop in the paper markets is not a simple pull back and "buying opportunity". Instead we believe this "correction" is a full blown "crash" that will take many years to recover from. Make no mistake that when the news of failing massive, financial corporation's no longer shocks the average investor because it has become so common place, a significant consequence is likely hiding around the corner. It is during times like this that we look for assets the world "needs" instead of assets the world "wants".
By Michael Kilback
Investmentscore.com
Investmentscore.com is the home of the Investment Scoring & Timing Newsletter. Through our custom built, Scoring and Timing Charts , we offer a one of a kind perspective on the markets.
Our newsletter service was founded on revolutionary insight yet simple principles. Our contrarian views help us remain focused on locating undervalued assets based on major macro market moves. Instead of comparing a single market to a continuously moving currency, we directly compare multiple major markets to one another. We expect this direct market to market comparison will help us locate the beginning and end of major bull markets and thereby capitalize on the largest, most profitable trades. We pride ourselves on cutting through the "noise" of popular opinion, media hype, investing myths, standard over used analysis tools and other distractions and try to offer a unique, clear perspective for investing.
Disclaimer: No content provided as part of the Investment Score Inc. information constitutes a recommendation that any particular security, portfolio of securities, transaction or investment strategy is suitable for any specific person. None of the information providers, including the staff of Investment Score Inc. or their affiliates will advise you personally concerning the nature, potential, value or suitability or any particular security, portfolio of securities, transaction, investment strategy or other matter. Investment Score Inc. its officers, directors, employees, affiliates, suppliers, advertisers and agents may or may not own precious metals investments at any given time. To the extent any of the content published as part of the Investment Score Inc. information may be deemed to be investment advice, such information is impersonal and not tailored to the investment needs of any specific person. Investment Score Inc. does not claim any of the information provided is complete, absolute and/or exact. Investment Score Inc. its officers, directors, employees, affiliates, suppliers, advertisers and agents are not qualified investment advisers. It is recommended investors conduct their own due diligence on any investment including seeking professional advice from a certified investment adviser before entering into any transaction. The performance data is supplied by sources believed to be reliable, that the calculations herein are made using such data, and that such calculations are not guaranteed by these sources, the information providers, or any other person or entity, and may not be complete. From time to time, reference may be made in our information materials to prior articles and opinions we have provided. These references may be selective, may reference only a portion of an article or recommendation, and are likely not to be current. As markets change continuously, previously provided information and data may not be current and should not be relied upon.
Investmentscore.com Archive |
© 2005-2022 http://www.MarketOracle.co.uk - The Market Oracle is a FREE Daily Financial Markets Analysis & Forecasting online publication.