


Stock Market Major Peak in Early April 2021
Stock-Markets / Stock Market 2021 Jan 03, 2021 - 01:29 PM GMTBy: Chris_Vermeulen

In the first part of this research article, we highlighted some of W.D. Gann’s research, particularly the theory of price vibrations, angles, slopes, and how they relate to future price projections/targets. We also showed how important it was to understand what price does when it reaches these critical inflection points. In this second part of our research, we are going to explore Gann time/price cycles and how they relate to our Fibonacci Price Amplitude Arcs.
Our research will show you exactly why we believe an early April 2021 peak may be setting up in the US/global markets and why you need to prepare for this now. We believe the remainder of the bullish price trend may continue to push higher, scaling very close to the CYAN trendline on the chart below over the next 60+ days before starting to break lower as we near the end of March 2021. Let’s explore why we believe this is likely to happen.
We highlighted the importance of the CYAN trend line and the multiple Fibonacci Price Amplitude Arcs that are arcing through the recent price range in Part I. It is our belief that these critical levels represent a major inflection point in the advance of price and that price may continue to attempt to push higher – but may align itself below the CYAN trendline as it inches closer to the early April Gann price/time arc that we believe will set up a major top in the markets.
Weekly SPY Chart Showing Key Price Trendline & Time Factors
When we apply time-factoring to the SPY chart below, we are inclined to support the theory that a 200% time factor applies to the current market setup from the lows established in 2009. If we measure price trend and vibration from the 2009 low point, we immediately come to the October 13, 2014 lows – which were subsequently retested multiple times over the next 3+ years (August 2015, January 2016, February 2016). Our researchers believe these lows represent the end of one cycle/vibration phase and the beginning of another. By aligning a mirror-image of the original Gann Time-Arcs to the October 2014 lows, we can see that another critical Gann Vibration cycle is likely ending near mid-April 2021 through early July 2021.
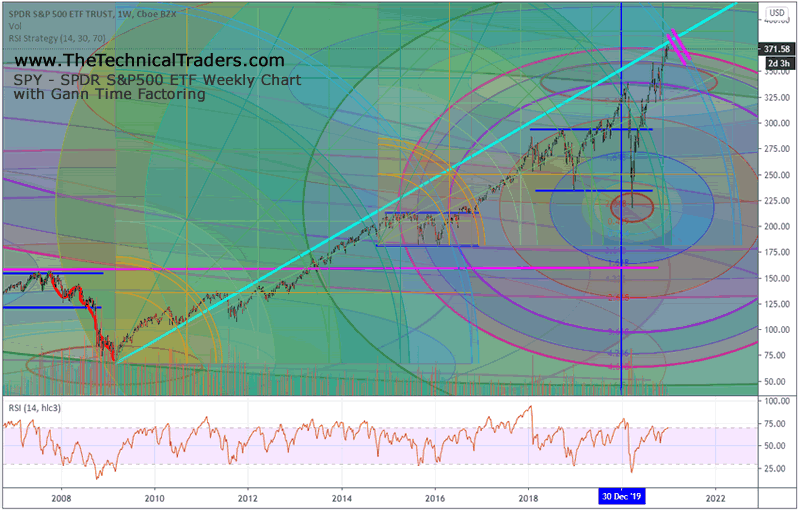
We believe the next few weeks and months, as well as almost all of 2021 and beyond, will be full of major trend changes and fluctuating price activity as global investors attempt to navigate the changes in the global markets. Currently, many of the foreign markets are nearing what appear to be peak levels and, if our Gann research is correct, the US stock market is only about 90 days away from reaching the start of another Gann Time-factoring Vibration energy phase/cycle. This means there is going to be another shift in how investors perceive value in investments and where capital moves to attempt to hedge/profit from this cycle phase.
Weekly SPY Chart Showing Key Price Trendline & Time Factors
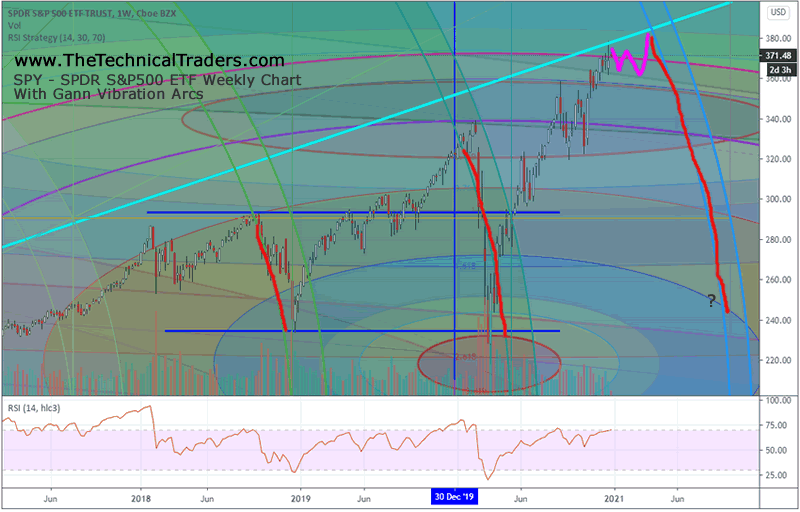
This next Weekly SPY chart shows a closer look at the Gann Time-factor arcs and how they aligned with the previous price corrections. Pay attention to how accurate these Gann Time-factor arcs predicted the downward price “vibrations” over the past three years. Remember, these Gann phases are a replica of the 2009 bottom to 2014 peak – applied to the 2014 low price levels. They represent an exact replica of the same price vibrations that took place between 2009 and 2014. They also show a period of time between April 2021 and July 2021 which may represent a very big, deep vibration in price which may target low price levels near $292 on the SPY.
Be sure to sign up for our free market trend analysis and signals now so you don’t miss our next special report!
The bigger question in our minds is “do our Fibonacci Price Amplitude Arcs align with W.D. Gann price/time theories and the Law Of Vibration?” If so, then our Fibonacci Price Amplitude Arcs may be somewhat close to what W.D. Gann attempted to describe relating to his Law Of Vibration and the universal key to unlocking the secrets of identifying and predicting future price peaks/troughs accurately. If not, then we are confident they will lead us to even more breakthroughs as we continue to attempt to adapt and improve our technical analysis research.
One thing is for certain, 2021 appears to be setting up as a traders market where trends may change very quickly and aggressively. 2021 is going to be a year where traders need to stay ahead of the risks and shifting market cycles to find the best assets to own and profit from. Our BAN technology was designed specifically to address this issue – always being able to find and identify the best assets to own within any type of trend.
Our researchers believe increased price volatility will likely be seen near the end of March 2021 and by mid-April 2021, we may already start to see signs of a broad market decline setting up. Our research suggests a deep bottom may setup in October 2021 or later. Are you ready for this type of move in the markets? If not, learn how BAN can help you trade the best assets by visiting www.TheTechnicalTraders.com.
Chris Vermeulen
www.TheTechnicalTraders.com
Chris Vermeulen has been involved in the markets since 1997 and is the founder of Technical Traders Ltd. He is an internationally recognized technical analyst, trader, and is the author of the book: 7 Steps to Win With Logic
Through years of research, trading and helping individual traders around the world. He learned that many traders have great trading ideas, but they lack one thing, they struggle to execute trades in a systematic way for consistent results. Chris helps educate traders with a three-hour video course that can change your trading results for the better.
His mission is to help his clients boost their trading performance while reducing market exposure and portfolio volatility.
He is a regular speaker on HoweStreet.com, and the FinancialSurvivorNetwork radio shows. Chris was also featured on the cover of AmalgaTrader Magazine, and contributes articles to several leading financial hubs like MarketOracle.co.uk
Disclaimer: Nothing in this report should be construed as a solicitation to buy or sell any securities mentioned. Technical Traders Ltd., its owners and the author of this report are not registered broker-dealers or financial advisors. Before investing in any securities, you should consult with your financial advisor and a registered broker-dealer. Never make an investment based solely on what you read in an online or printed report, including this report, especially if the investment involves a small, thinly-traded company that isn’t well known. Technical Traders Ltd. and the author of this report has been paid by Cardiff Energy Corp. In addition, the author owns shares of Cardiff Energy Corp. and would also benefit from volume and price appreciation of its stock. The information provided here within should not be construed as a financial analysis but rather as an advertisement. The author’s views and opinions regarding the companies featured in reports are his own views and are based on information that he has researched independently and has received, which the author assumes to be reliable. Technical Traders Ltd. and the author of this report do not guarantee the accuracy, completeness, or usefulness of any content of this report, nor its fitness for any particular purpose. Lastly, the author does not guarantee that any of the companies mentioned in the reports will perform as expected, and any comparisons made to other companies may not be valid or come into effect.
Chris Vermeulen Archive |
© 2005-2022 http://www.MarketOracle.co.uk - The Market Oracle is a FREE Daily Financial Markets Analysis & Forecasting online publication.