USD/JPY Strategy and Yield Curve Analysis
Currencies / Forex Trading Oct 17, 2008 - 06:19 AM GMTBy: Ashraf_Laidi

 Violent volatility maintains its daily routine of aggressive swings, as US equities close 5% higher after more than a 9% decline yesterday, dragging risk appetite and currencies along with them. Wednesday's trading session saw a short-lived attempt for economic reports to reassert their dominance on financial markets before risk took over on Thursday. Market players were astounded by the fact that neither the 34-year lows in US industrial production, nor 18-year lows in the Philadelphia Fed index nor the record lows in the US National Association of Homebuilders' index dipping managed to bring down US stocks.
Consequently, currency traders shrugged off the fundamental reports and sought to trade in the tune of swinging risk aversion. Today's turnaround in US equities propped partly by a decline in interbank rates and modest stabilization in global credit markets.
The resulting dollar rally was enforced by oil's decline past the 50% losing mark from its summer record highs, prompting a general sell-off in commodities and renewed interest in the greenback. NYMEX light sweet crude settled at $69.85 per barrel from an intraday high of $74.50.
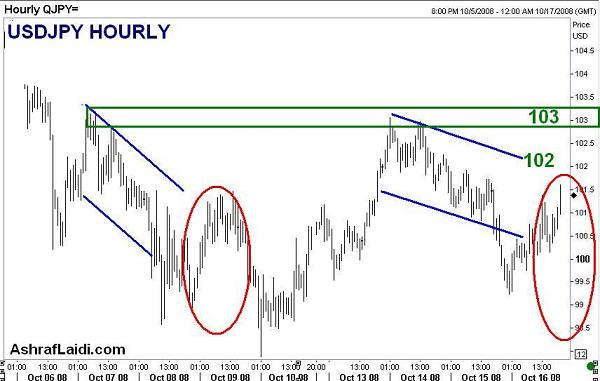
USDJPY To Fail 103 Retest
We turn our focus to the hourly chart of USDJPY, which is displaying a familiar pattern of short-lived rebounds. The pair is testing the 101.50-55 resistance we indicated in our morning note, and will likely extend momentum towards the trend line resistance of 102 thanks to the impact of today's Wall Street rally on Asian trade. But with the deepening erosion in the real economy echoing across the different sectors, traders may not extend the current pick up in risk appetite past the 103 level, which presents the 61.8% retracement of the decline from 106.11 high to the 97.84 low. A break of 103 will have to test 103.75, but failure to breach above 103 is likely to be accompanied by the next trigger of risk aversion, sending back the pair back towards 101.20 and 99.00.

What Steepening Yield Curves Are Telling US
The chart below shows the steepness of the US, Eurozone and UK yield curves as measured by the difference between yields on 10- and 2-year government yields, known as the 10-2 spread. Steepening yield curves or rising spreads reflect plummeting 2-year yields relative to 10-year yields, hence, an expectation for further declines in the benchmark target of short-term interest rates i.e. the overnight interest rates set by central banks. US, UK and EU curves are steepening to their highest levels in four, five and three years, with the highest showing the greatest probability for central bank easing and the lowest suggesting the least probability for incoming rate cuts .
This is in synch with the markets' expectations for the Bank of England being the most likely to deliver the most in rate cuts and the European Central Bank the least likely to do so in the next 2 months . For more detail on the forex implications of the diverse shapes in interbational yield curves, explore Chapters 6 and 9 of my book " Currency Trading & Intermarket Analysis ." Now available for order online.

By Ashraf Laidi
CMC Markets NA
AshrafLaidi.com
Ashraf Laidi is the Chief FX Analyst at CMC Markets NA. This publication is intended to be used for information purposes only and does not constitute investment advice. CMC Markets (US) LLC is registered as a Futures Commission Merchant with the Commodity Futures Trading Commission and is a member of the National Futures Association.
Ashraf Laidi Archive |
© 2005-2022 http://www.MarketOracle.co.uk - The Market Oracle is a FREE Daily Financial Markets Analysis & Forecasting online publication.


