


US Dollar Decline creates New Sector Opportunities to Trade
Currencies / US Dollar Jan 22, 2021 - 02:49 PM GMTBy: Chris_Vermeulen

The weakness in the US Dollar, which initiated after the Covid-19 peak in March 2020, has entered an extended downward price trend which is nearing a key support level near 88.33. One key factor related to this trend is a weakness in the US Dollar, which means other foreign currencies become comparatively stronger. This transitional currency valuation phase creates an environment where localized foreign investments may become much more opportunistic than the US stock market/sectors if this US Dollar decline continues. Simply put, foreign investors will suddenly start to realize they are losing alpha in US Dollar based investments compared to stronger, foreign currency-based investments over time and move their capital to profit from the US Dollar’s decline.
US Dollar Index Monthly Chart
The 88.33 level on the US DollarWeekly chart below is, in our opinion, critical because a breakdown below this level will likely initiate a downside trend that targets the 82.50 level, a 9% decline for the US Dollar. Recent support in the US Dollar has helped to continue to US stock market rally over the past few weeks. Everything hinges on if the 88.33 support level holds or if it is broken. We believe if this support level is broken in the near future, the US stock markets may experience a broad market rotation in trend which ould very likely be in excess of 8%.
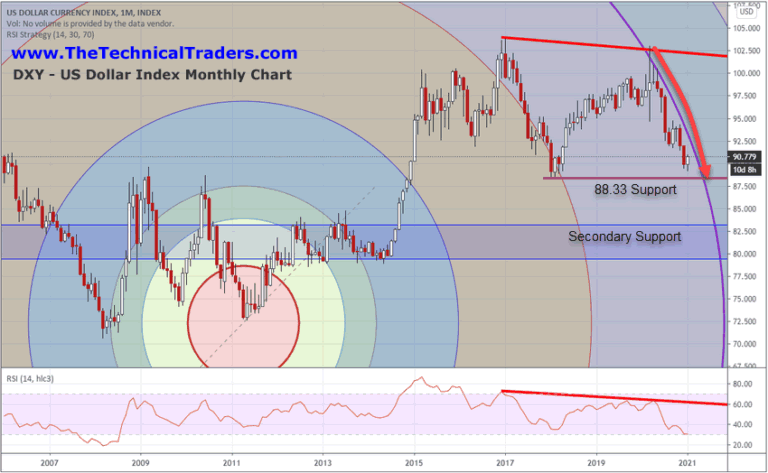
What happens over the next 2 to 4+ months with the new US President, policies, and Federal stimulus plans could prompt a big US/global market/sector rotation as investor’s expectations shift to address these new opportunities. If the US Dollar holds above 88.33 while these new stimulus packages and policies are enacted, then the US stock market indexes may continue to push dramatically higher over time. If the US Dollar breaks lower, below the 88.33 level, then there is a strong potential that global investors will identify strength in foreign market assets/stock in localized currencies and pull money away from US assets.
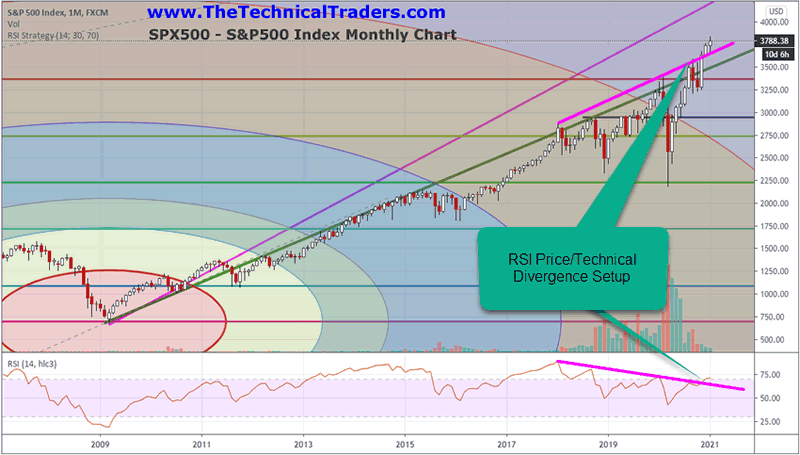
S&P500 Index Monthly Chart
The Monthly S&P 500 Index chart below highlights the very clear RSI Technical Divergence pattern that has set up across the peaks originating from the January 2018 highs. Each subsequent high price peak has setup a lower RSI peak – resulting in a “Divergence” technical pattern. Even the current breakout rally after the November 2010 elections has established a higher price level and a lower RSI level than the January 2020 RSI peak.
Be sure to sign up for my FREE webinar that will teach you how to find and trade my BEST ASSET NOW strategy on your own!
Our researchers believe this longer-term technical divergence patter may be indicative of a “capital shift” process that could take place in 2021 if the US Dollar continues to slide below the 88.00 level. Weakness in the US Dollar will shift expectations away from US Stock Market strength and towards foreign market strength – just like what happened between 2010 and 2014 when Emerging Markets rallied while the US Dollar flat-lined near 80.00
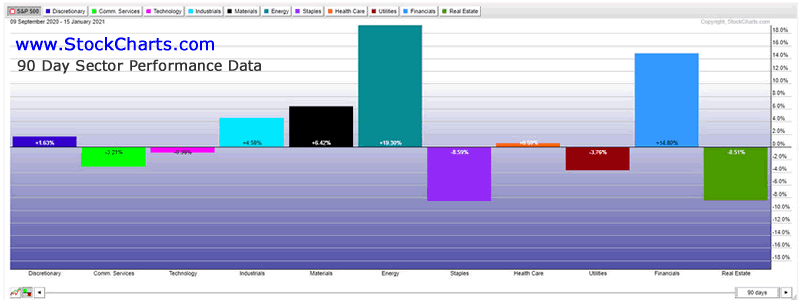
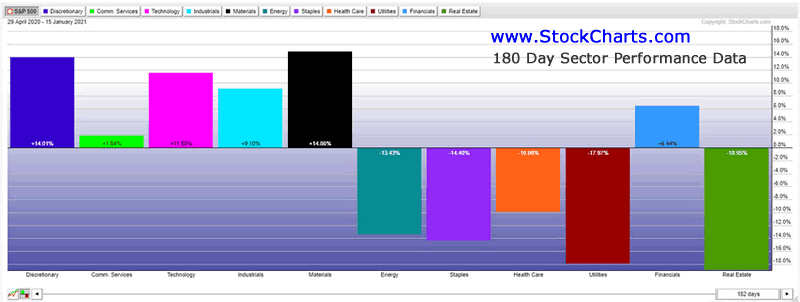
If this type of capital shift happens over the next 3 to 6+ months, US market sectors are very likely to shift focus as foreign capital moves away from US equities and begins to chase Alpha in localized capital market assets and foreign market ETFs. This can already be seen in major US sectors by looking at the 90-day performance compared to the 180-day performance data.
For example, over the past 90 days, Energy, Financials, Materials, and Industrials have been the strongest S&P sectors. Yet, over the past 180 days, Materials, Industrials, Technology, and Discretionary sectors have outperformed. This suggests a shift is already taking place where Discretionary and Technology sectors have stalled in their advance while Energy and Financials have started to rally. Just recently, Energy, Health Care, Utilities, Financials, and Real Estate have all started to increase performance while Staples, Technology, and Comm. Services have shown increased downside performance metrics.
It is becoming very obvious that capital is being shifted away from Discretionary, Technology, Comm. Services, Industrials, and Materials and being deployed more heavily into Energy, Health Care, Utilities, Financials, and Real Estate based on this data.
90 Day S&P Sector Performance
180 Day S&P Sector Performance
Our research suggests a number of big price trends and rotations are likely to take place in 2021. Our “What to expect in 2021” research article highlighted potential weakness in February/March 2021 and broader market weakness in August/September 2021. We feel the transitional capital market shift, as a result of the declining US Dollar, will accelerate this capital/sector shift over the next 6+ months and put foreign market assets, Emerging markets, and currency trends firmly ahead of US stock market performance this year. If the 88.00 level is broken on the US Dollar chart, then this currency/foreign market focus will become even more critical.
2021 is a year for traders to be prepared for broad market sector rotation, big trends in ETFs and currencies, and increased volatility in the US markets – somewhat similar to 2013 through 2016. The downward trend in the US Dollar may setup some very big moves in foreign ETFs, US ETF sectors, and many US Stocks. It also appears that Energy, Financials, Materials, and Utilities are currently outperforming Technology, Comm. Services, Industrials, and others. If you are not watching these trends shift, you will miss some really big trading opportunities.
I teach you how to find the hottest sectors and trading opportunities in my free BAN strategy webinar. For those who want to cut the research out entirely, the BAN Trader Pro newsletter service will help you navigate the big trends, high volatility, stimulus, and new US government policies. The time is now to learn and trade the Best Assets Now Hotlist using our proven sector rotation strategy. Our BAN Trader Pro strategy is proving to be an incredible advancement that allows us to dominate and generate Alpha. We urge you to take advantage of the BAN Trader Pro newsletter service to prepare for the big trends that we expect to continue throughout all of 2021 and into 2022 and beyond.
Stay safe!
Chris Vermeulen
www.TheTechnicalTraders.com
Chris Vermeulen has been involved in the markets since 1997 and is the founder of Technical Traders Ltd. He is an internationally recognized technical analyst, trader, and is the author of the book: 7 Steps to Win With Logic
Through years of research, trading and helping individual traders around the world. He learned that many traders have great trading ideas, but they lack one thing, they struggle to execute trades in a systematic way for consistent results. Chris helps educate traders with a three-hour video course that can change your trading results for the better.
His mission is to help his clients boost their trading performance while reducing market exposure and portfolio volatility.
He is a regular speaker on HoweStreet.com, and the FinancialSurvivorNetwork radio shows. Chris was also featured on the cover of AmalgaTrader Magazine, and contributes articles to several leading financial hubs like MarketOracle.co.uk
Disclaimer: Nothing in this report should be construed as a solicitation to buy or sell any securities mentioned. Technical Traders Ltd., its owners and the author of this report are not registered broker-dealers or financial advisors. Before investing in any securities, you should consult with your financial advisor and a registered broker-dealer. Never make an investment based solely on what you read in an online or printed report, including this report, especially if the investment involves a small, thinly-traded company that isn’t well known. Technical Traders Ltd. and the author of this report has been paid by Cardiff Energy Corp. In addition, the author owns shares of Cardiff Energy Corp. and would also benefit from volume and price appreciation of its stock. The information provided here within should not be construed as a financial analysis but rather as an advertisement. The author’s views and opinions regarding the companies featured in reports are his own views and are based on information that he has researched independently and has received, which the author assumes to be reliable. Technical Traders Ltd. and the author of this report do not guarantee the accuracy, completeness, or usefulness of any content of this report, nor its fitness for any particular purpose. Lastly, the author does not guarantee that any of the companies mentioned in the reports will perform as expected, and any comparisons made to other companies may not be valid or come into effect.
Chris Vermeulen Archive |
© 2005-2022 http://www.MarketOracle.co.uk - The Market Oracle is a FREE Daily Financial Markets Analysis & Forecasting online publication.