


Are We Days Away From Potential Gann/Fibonacci Stock Market Price Peak?
Stock-Markets / Stock Market 2021 Mar 19, 2021 - 06:56 PM GMTBy: Chris_Vermeulen

We have received many emails from members and readers asking us to follow-up on our December 30, 2020, Gann/Fibonacci research article entitled “Price Amplitude Arcs/Gann Suggest A Major Peak in Early April 2021 – Part II“. In that article, my research team suggested a major price peak may set up in early April 2021. Now we are only a few weeks away from the start of April and we believe the US major indexes have already started to make their move related to the Gann/Fibonacci peak prediction. Let’s review our original research and then take a look at what is happening on the charts right now.
Before we get started, please know that this article talks about the long-term trend and pattern forming. This topping setup may drag out until later this year, possibly August and beyond. As always, we do not trade or invest based on predictions. We simply follow the price. Until the market price confirms a new downtrend, we will remain long stocks.
Revisiting Our Gann Price/Time Arc Research
In our original article, I highlighted how Gann price arcs and time elements, when duplicated from the 2009 bottom and anchored to the 2016 lows, aligned quite well with the pullbacks in 2018, 2020. It also predicted an April 2021 Gann Arc which could represent a moderately big price correction in the future. The following weekly SPY chart from our original article highlights these technical setups. What may be difficult to see on this chart are the Gann Price/Time arcs. The fist one originates at the low of 2009 and extends to the peak in 2016. The second one is a duplicate of the first and is aligned at the low of 2016.
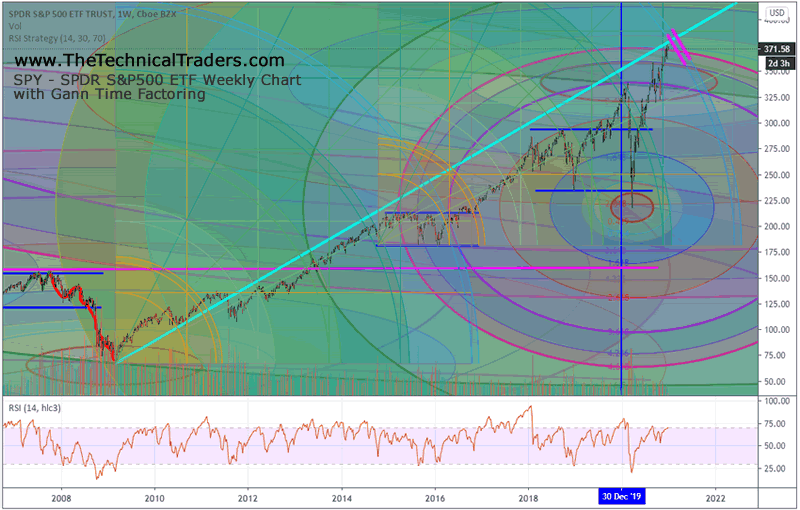
What we found interesting in this technical pattern is that the original move from the bottom in 2009 seemed to replicate in Gann structure after the lows in 2016. If our research is correct, then a broad market correction may start in late March 2021 or in early April 2021 (near the downward MAGENTA lines on the right side of this chart).
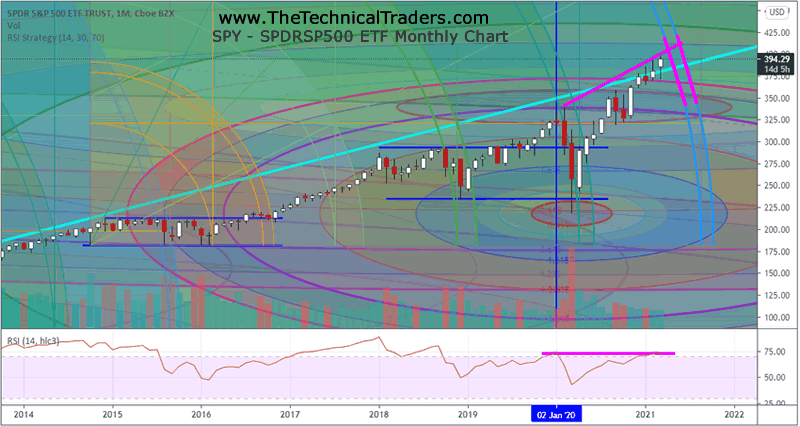
As we revisit that chart, on a Monthly bar basis, we can clearly see how the rally in the SPY has prompted a price trend above the CYAN line – which we warned about in our original article:
“You can also see our proprietary Fibonacci Price Amplitude Arcs drawn on the chart above. We believe these are aligned with price energy frequencies and help us to understand where and when price inflection points may occur. It may be difficult for you to see the multiple Fibonacci Price Amplitude Arcs that align near the current price high, but there are three unique Fibonacci Price Amplitude arcs spanning this peak:
1. The $373.92 Arc aligning from the February 18, 2020 peak
2. The $370.30 Arc aligning from the March 23, 2020 bottom
3. The $364.04 Arc aligning from the March 20, 2000 peak
We believe it is important to see how price reacts to the current potential peak setup after reaching the CYAN upward sloping price channel/line near these inflection points. If price fails to establish any support above the $379~380 price level on the SPY, then a technical failure will have set up – likely prompting a moderately strong downside price trend in the near future.“
Gann Price/Time Arcs Applied to Current SPY Chart
In the original article we warned that any failure of price above the support level of $379~380 may prompt a technical price failure. Currently, the SPY is trading near $397.40 and Treasury Yields have started to move higher, a warning that the markets may be under-pricing risks. Additionally, Gold and Silver continue to stay somewhat strong near recent support. Depending on how the markets interpret the FOMC outcome and perceive future risks, the current price level in the SPY is primed for our Gann price/time event.
One key element of the following Monthly SPY chart is the current price rally, after the COVID-19 peak in February 2020, and the moderately flat movement of the RSI indicator (in the lower pane). This suggests “divergence” between the current price peak and the movement in the RSI indicator – another component that suggests the Gann/Fibonacci price/time peak may be valid.
Gann Price/Time Arcs Applied to Our Smart Cash Index
If we search for evidence to help substantiate our original research using similar tools, we can see the Smart Cash Index, one of our proprietary custom index charts, also shares similar Gann price/time alignments. The Monthly Smart Cash Index chart, below, originates a Gann Arc at the 2009 lows and duplicates that Gann Arc originating at the 2016 lows (just like the charts above). We can see the current price activity, which has recently reached new all-time highs, also aligns with a Gann price/time Arc (highlighted by MEGENTA Lines near the right edge of the chart).
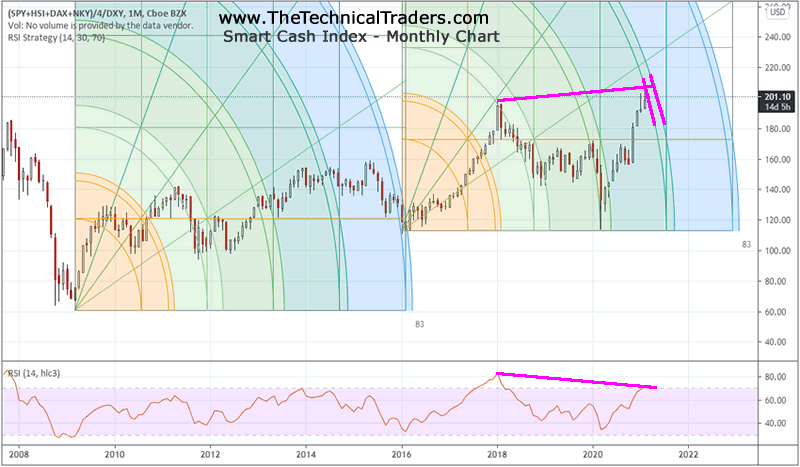
If our analysis is accurate, these cross-symbol alignments in price and Gann Arcs may prompt a fairly big rotation in the markets related to unexpected risks. We can’t be certain what will prompt this move in terms of news events, credit risks or other global events, bet we do know that a higher likelihood of this event taking place exists because historically the alignment of these Gann and Fibonacci price arcs have proven to generate broad market price inflection points.
Be sure to sign up for our free market trend analysis and signals now so you don’t miss our next special report!
Take a look at this Custom Smart Index chart and where the Gann Arcs appeared in the past. Peaks in price happen near, within or just after these Gann Arcs on this chart with a high degree of predictability. Should we ignore the warning of an early April 2021 potential peak right now? My research team and I believe traders/investors should stay keenly aware of the risks ahead and watch for signs of any continued market weakness over the next 15+ days.
Gann Price/Time Arcs Applied to Precious Metals
This last Custom Precious Metals Index Monthly Chart, below, shares similar Gann price/time arcs – although on this chart I used the low in late 2015 as the origination point and carried the Gann arcs out to the high in 2020. Then, I duplicated that arc and applied it to the low price in mid 2018 to see how it aligned with current price trends. Amazingly, the Gann arcs overlapped almost perfectly.
What my team found interesting on this Custom Precious Metals chart was how the overlapping Gann arcs helped to define the contraction price ranges in price. Nearly every downward price trend on this chart aligns almost perfectly with the Gann price/time arch and the duplicated Gann arcs apply very nicely to the rally in metals from mid-2018 onward. Even the peak in 2020 and the recent lows in 2021 align perfectly with these Gann price/time arcs and suggest a recovery in precious metals is pending.
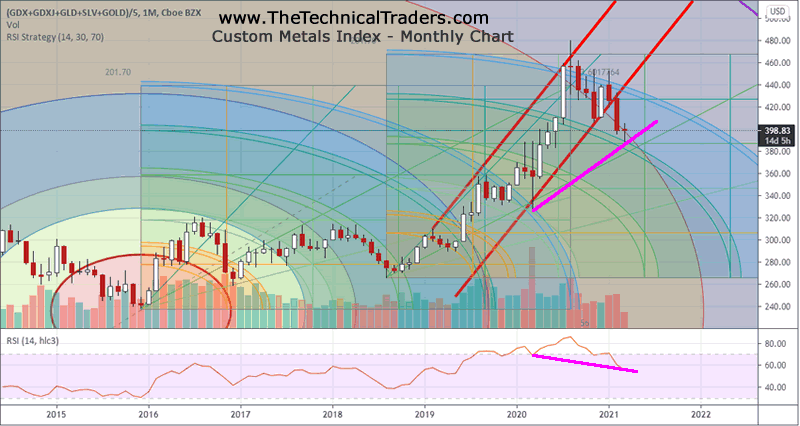
The divergence in the RSI indicator, on the bottom pane, suggests this recent low is likely to end soon with a new upward price trend in precious metals. Ideally, we would watch for it to rally back above the current BLUE Gann price/time arc and attempt to move above the $480 level on this Custom Precious Metals Index chart. When metals are moving higher in this manner, it suggests the US major indexes and the US Dollar may be weaker overall.
After a careful review of the original research article and the current chart setups/content, we still believe an early April 2021 peak may setup in the markets and may prompt a moderate downside price rotation. There are a number of elements that continue to drive some concern right now – US Fed actions, Treasury Yields, Commodity Prices and the strength/weakness of the US Dollar.
Even though we are not going to attempt to predict what may cause this moderate downside price event to begin to take place near early April 2021, we will suggest that it will likely be preceded by a rise in precious metals (as traders/investors attempt to shield themselves from risks) and/or a broader concern in the credit/debt markets which may prompt Treasuries and/or Repo rates to skyrocket. The rally in the markets above the CYAN line on the first two charts above suggests the markets have entered an excess/parabolic price phase – a super-bull trend. It is very uncommon for any stock market to enter this type of price phase and stay in this mode for extended periods of time. Price normally reacts by entering “pullback phases” which shake out weaker positions, revalue price levels and allow the markets to attempt another bullish trend.
We have not really seen a moderate pullback in the price trend since the COVID-19 collapse or the 2018/2019 price corrections. All the other recent pullbacks in this rally have been very brief price contractions. With the US Fed attempting to “clear a path” for further economic recovery and attempting to wash away market concerns, both active traders and longer-term investors should prepare for even more volatility and bigger price swings in any eventual outcome.
If the markets do fail near our Gann arcs, then we may see a bigger downside move in the US major markets sometime after April 1, 2021. If they don’t fail to break lower in April 2021, then the “everything bubble” will likely continue to rally higher. These are very exciting times for traders and investors! What we expect to see is not the same type of market trend that we have experienced over the past 8+ years – this is a completely different set of market dynamics. Don’t miss the opportunities in the broad market sectors in 2021, which will be an incredible year for traders of the BAN strategy. You can sign up now for my FREE webinar that teaches you how to find, enter, and profit from only those sectors that have the most strength and momentum. Staying ahead of sector trends is going to be key to success in volatile markets.
For those who believe in the power of trading on relative strength, market cycles, and momentum but don’t have the time to do the research every day then my BAN Trader Pro newsletter service does all the work for you with daily market reports, research, and trade alerts. More frequent or experienced traders have been killing it trading options, ETFs, and stocks using my BAN Hotlist ranking the hottest ETFs, which is updated daily for my premium subscribers.
Happy trading!
Chris Vermeulen
www.TheTechnicalTraders.com
Chris Vermeulen has been involved in the markets since 1997 and is the founder of Technical Traders Ltd. He is an internationally recognized technical analyst, trader, and is the author of the book: 7 Steps to Win With Logic
Through years of research, trading and helping individual traders around the world. He learned that many traders have great trading ideas, but they lack one thing, they struggle to execute trades in a systematic way for consistent results. Chris helps educate traders with a three-hour video course that can change your trading results for the better.
His mission is to help his clients boost their trading performance while reducing market exposure and portfolio volatility.
He is a regular speaker on HoweStreet.com, and the FinancialSurvivorNetwork radio shows. Chris was also featured on the cover of AmalgaTrader Magazine, and contributes articles to several leading financial hubs like MarketOracle.co.uk
Disclaimer: Nothing in this report should be construed as a solicitation to buy or sell any securities mentioned. Technical Traders Ltd., its owners and the author of this report are not registered broker-dealers or financial advisors. Before investing in any securities, you should consult with your financial advisor and a registered broker-dealer. Never make an investment based solely on what you read in an online or printed report, including this report, especially if the investment involves a small, thinly-traded company that isn’t well known. Technical Traders Ltd. and the author of this report has been paid by Cardiff Energy Corp. In addition, the author owns shares of Cardiff Energy Corp. and would also benefit from volume and price appreciation of its stock. The information provided here within should not be construed as a financial analysis but rather as an advertisement. The author’s views and opinions regarding the companies featured in reports are his own views and are based on information that he has researched independently and has received, which the author assumes to be reliable. Technical Traders Ltd. and the author of this report do not guarantee the accuracy, completeness, or usefulness of any content of this report, nor its fitness for any particular purpose. Lastly, the author does not guarantee that any of the companies mentioned in the reports will perform as expected, and any comparisons made to other companies may not be valid or come into effect.
Chris Vermeulen Archive |
© 2005-2022 http://www.MarketOracle.co.uk - The Market Oracle is a FREE Daily Financial Markets Analysis & Forecasting online publication.