


Stock Market Pause in an Uptrend
Stock-Markets / Stock Market 2021 Mar 23, 2021 - 04:38 PM GMTBy: Andre_Gratian

Current Position of the Market
SPX Long-term trend: There is some evidence that we are still in the bull market which started in 2009 and which could continue into the first half of 2021 before major cycles take over and it comes to an end.
SPX Intermediate trend: SPX may have completed a phase of its intermediate uptrend and is consolidating.
Analysis of the short-term trend is done daily with the help of hourly charts. They are important adjuncts to the analysis of daily and weekly charts which determine longer market trends.
Daily market analysis of the short-term trend is reserved for subscribers. If you would like to sign up for a FREE 2-week trial period of daily comments, please let me know at anvi1962@cableone.net
Market Pause in an Uptrend
Cycles: Looking ahead!
90-yr cycle – Last lows: 1843-1933. Next low: ~2023
40-yr cycle -- Last lows: 1942 -1982. Next low: ~2022
7-yr cycle – Last lows: 2009-2016. Next low: ~2023
Market Analysis (Charts, courtesy of QCharts)
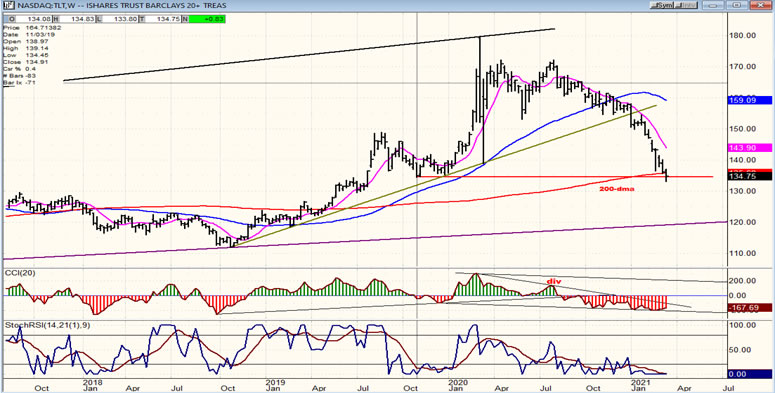
TLT (weekly)
In my previous newsletter, I showed a weekly chart of TLT which had been declining since July of last year in a steepening downside curve, which is worrying some analysts that this could mark the beginning of an inflationary trend. The chart below is adjusted to show last week’s action in TLT. It dipped a little lower than its November 2019 support, and closed right on it. Last week’s close also puts it slightly below its 200-wk MA. The Federal Reserve had pushed interest rates to an abnormally low level in March 2020, and this could, for now be a simple adjustment to a more normal level. A continued protracted price decline toward the lower trend line which goes back to 2011 would be a concern, especially if the trend line were broken.
The CCI is beginning to flatten but does not yet show clear positive divergence, suggesting that the near-term low in TLT is probably still ahead of us.
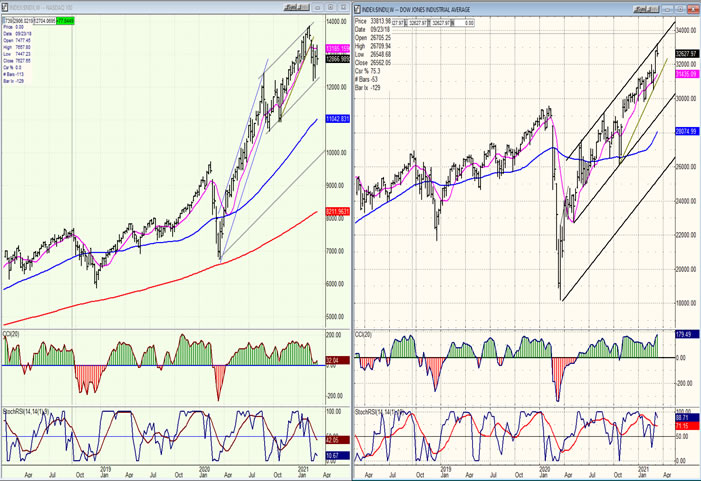
NDX - DJIA (weekly)
Last week, I also mentioned that the rise in interest rates is helping to lift financial shares and weighs heavily on technology stocks. You can see this plainly in the charts below which compare the recent performance of NDX to DJIA. These charts also suggest that we need not (yet) worry about having made a bull market high. Even NDX, despite its recent weakness, remains in an uptrend although this could change over the next few weeks as pressure from rising rates becomes more intense.
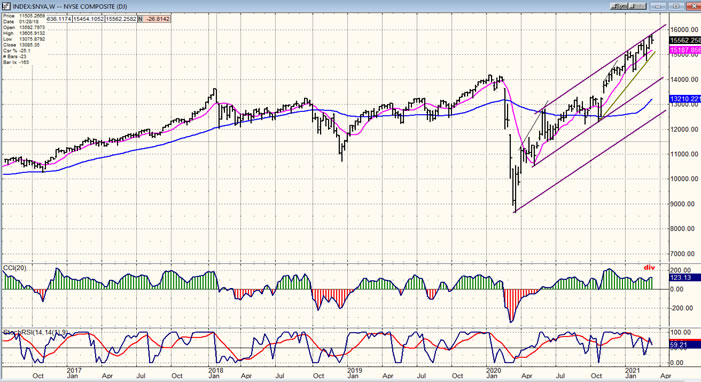
NYA (weekly)
SPX, which is a composite of the two indices above, will alert us to the formation of a significant market top. Although, if we want to monitor the total market, we should also monitor the New York Stock Exchange Composite which is the most broad-based index.
It, too, like the DJIA, made a new high last week and corrected slightly. When compared to the DJIA, it is only a tad weaker. Its weekly CCI is showing divergence but is still very much in the green -- probably signifying that it has not yet reached a significant high point. Nevertheless, we’ll keep a close watch on this index as well, especially as we approach mid-year.
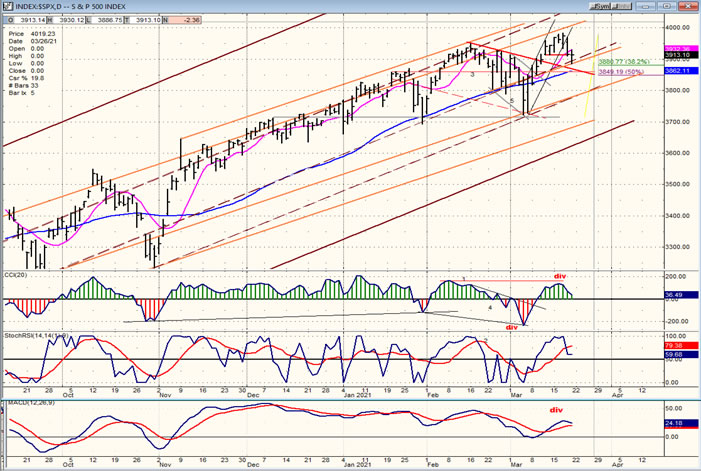
SPX daily chart
SPX is probably as good as any index to analyze what the market is doing. And by complementing the perspective attained by observing a bar chart with that of a Point & Figure chart, one can arrive at a reasonable appreciation of the opportunity and the risk factor inherent in the entire stock market.
SPX recently corrected from 3950 down to 3723 and has since made a new high at 3984. Last week a new short-term correction brought prices back down to 3887 which amounted to a .382 retracement of the previous rally where SPX also found parallel lines of support. That support created a rally which rebounded to the level of the 9-dma before finding resistance and began to pull back into Friday’s close. Even without the selling into the last hour of trading, it would have been apparent that the correction was probably not over. How much more can we expect? If we can surpass Friday’s low, a 50% retracement of the rally down to 3849 would be a good bet, since it also coincides with support from the mid-January high. I would not expect more of a consolidation than this for now and believe that the index will have to rise at least to 4150 before the next intermediate top.
All three oscillators are still in a downtrend and suggest that a slightly deeper correction is ahead.
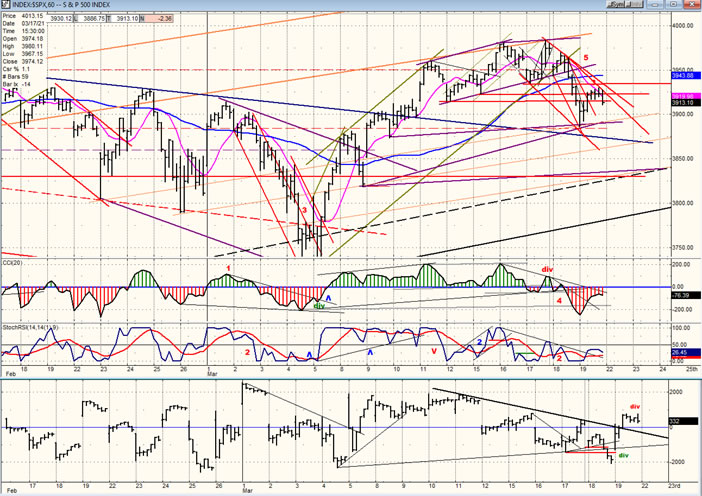
SPX hourly chart
From the 3723 low, SPX had an initial strong rally of 60 points before a quick consolidation. This was followed by a new high to 3960, which now allowed us to draw the outer channel line of the rally and wait for deceleration to take place. Also, by drawing a parallel to the outer line, we now had our completed channel, and we could wait for the index to walk across the channel to challenge the uptrend line. The P&F pattern had suggested a move to about 3980-90; so, when, after touching the channel line, the index pushed a little higher to 3990 and started retracing, it was a clue that a correction was about to start. Warning also came from negative divergence in the CCI.
The first leg of the correction was a .382 retracement followed by a rebound on Friday, but the selling into the close and the lack of positive divergence in the CCI is suggesting that we have not yet seen the low. We will look for it between 3840 and 3860.
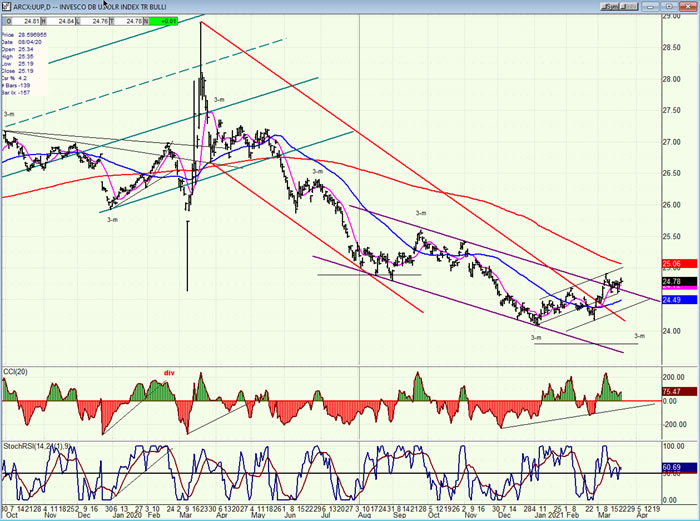
- UUP (dollar ETF) DLY ($USD chart is not available from this data provider)
- UUP is trying to extend its short-term uptrend a little closer to 25.00 where it will meet its 200-dma. If it does push a little higher, it could make another 3-mo cycle inversion before rolling over. A new short-term high would also create some negative divergence in the CCI and set up UUP for a reversal.
-
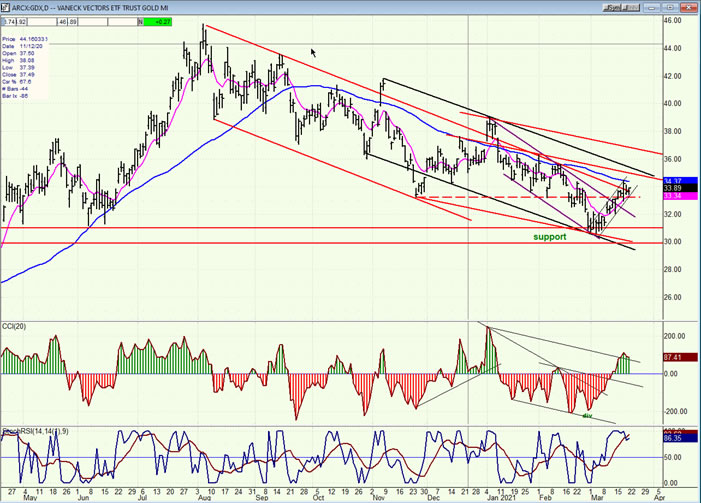
- GDX (gold miners)-DLY
- GDX has moved off its low, and it is likely that it has ended its correction. However, the current move could be limited to the top of the channel. If, after a correction of about 50% of the uptrend, it reverses again to the upside, it may then experience a stronger move as it rises outside of its corrective channel. The P&F chart suggests that the current move can take it to about 35.50-36.00.
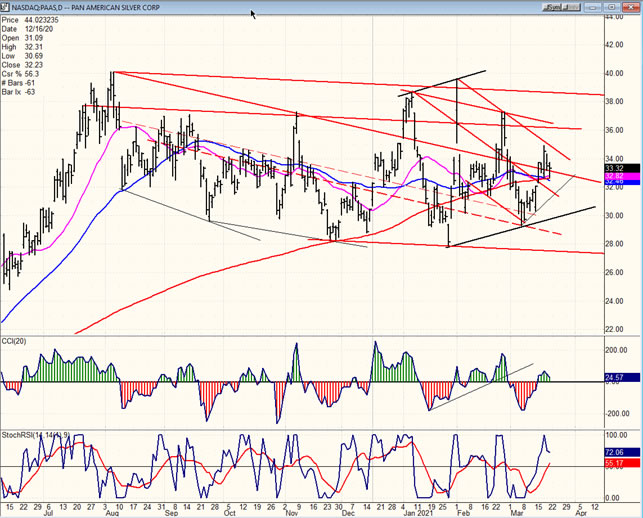
- PAAS (Pan American Silver Corp-DLY)
- During its current uptrend from the low, PAAS managed to overcome the 9-dma, the 50-dma, and the 200-dma in one fell swoop. It has now retested them twice, but the 50-dma is still in a downtrend. This suggests that a little more consolidation may be due at this level, especially if SPX has another pullback, then a move to ~36 before more consolidation.
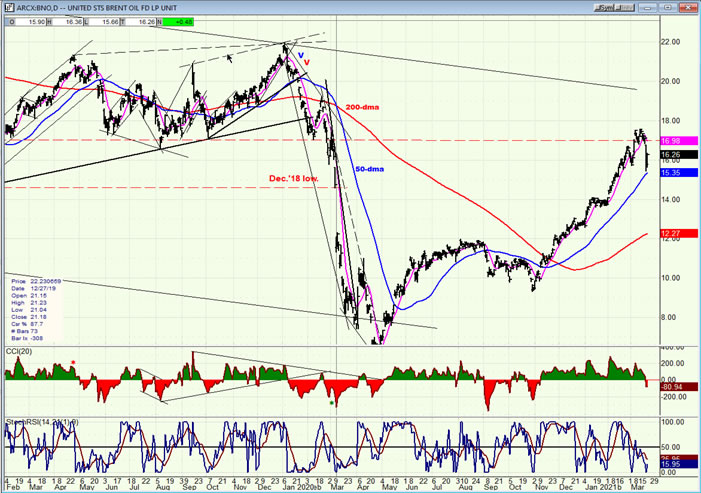
- BNO (Brent oil fund) DLY.
- Last week I mentioned that BNO had run into resistance and could reverse. More consolidation/correction is likely due before it can retest its recent high.
- SUMMARY
- SPX is undergoing a short-term correction which looks as if it needs a little more time and a little more corrective action before it is ready to continue its uptrend.
Andre
Free trial subscription
With a trial subscription, you will have access to the same information that is given to paid subscribers, but for a limited time-period. Over the years, I have developed an expertise in P&F charting (price projection), cycles (timing), EWT (structure), and general technical analysis which enables me to warn subscribers of pending reversals in market trends and how far that trend can potentially carry. For a FREE 2-week trial, subscription options and payment plans, I encourage you to visit my website at www.marketurningpoints.com.
Disclaimer - The above comments about the financial markets are based purely on what I consider to be sound technical analysis principles uncompromised by fundamental considerations. They represent my own opinion and are not meant to be construed as trading or investment advice, but are offered as an analytical point of view which might be of interest to those who follow stock market cycles and technical analysis.
Andre Gratian Archive |
© 2005-2022 http://www.MarketOracle.co.uk - The Market Oracle is a FREE Daily Financial Markets Analysis & Forecasting online publication.