


After Fed Week – Stock Market What’s Next?
Stock-Markets / Stock Market 2021 Mar 26, 2021 - 05:02 PM GMTBy: Chris_Vermeulen

In the first part of this research article, we shared more detail related to the Excess Phase Peak technical pattern that is setting up in the NASDAQ and to highlight the validity of our Gann/Fibonacci Technical research which suggested a peak in the markets may set up sometime after April 1, 2021. We’ve received many questions and comments from our readers and followers related to these articles. Many people seem to believe we are calling for an April 1 market peak based on this research, yet the technical patterns we are highlighting suggest a longer-term market peak may already be setting up.
In this second part of our more detailed “what next” article, my research team and I will highlight exactly why we believe traders and investors need to be prepared for an extended technical topping pattern and how it will likely set up over the next 60 to 90+ days. Let’s continue our research from Part I and go into more detail related to this technical setup.
In Part I, we focused on the NASDAQ and how the recent downside price rotation may align with our Gann/Fibonacci research as well as align with the Excess Phase Topping pattern highlighted in our November 2020 research. Now, we’re going to focus on the Dow Jones Industrial Average and our Custom US Stock Market Index showing how these two market sectors have yet to react like the NASDAQ already has.
Dow Jones Has Yet To Break Key Price Channel
Looking at the chart below, we can see that the INDU has yet to break the YELLOW upward price trend line. We have not seen price move below this support channel yet, thus we don’t have any confirmation that a weakening in price trend is taking place. In fact, recently the INDU has rallied higher over the last few weeks as capital has shifted away from the NASDAQ and into various other sectors.
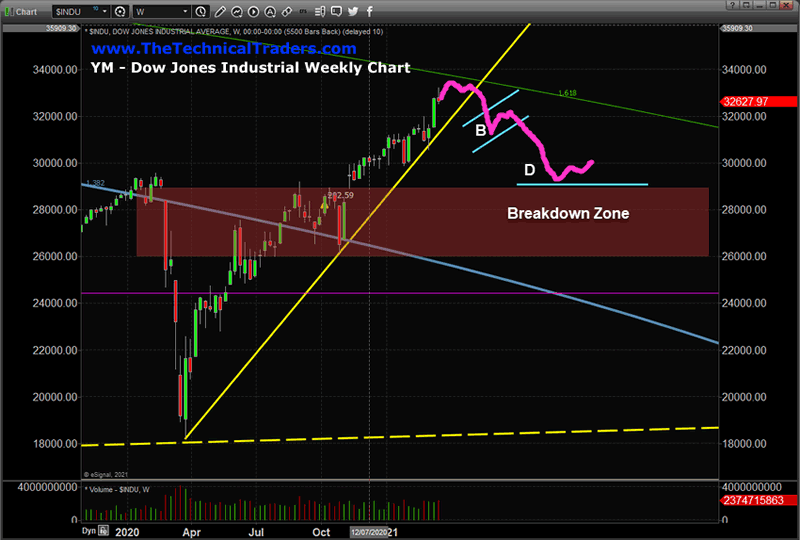
Next, we believe the INDU still has another 3% to 5% to rally further before reaching the GREEN 1.618% Fibonacci Price Amplitude Arc on the chart below. This suggests the INDU may continue to rally a bit further before reaching resistance while the NASDAQ may attempt a more moderate price rally within the sideways (#B) Flagging channel. This setup suggests the INDU and SPY have not yet reacted to price weakness like the NASDAQ already has.
Be sure to sign up for our free market trend analysis and signals now so you don’t miss our next special report!
We’ve drawn a MAGENTA line on this chart highlighting what we believe a “technical breakdown” in price will look like for the INDU. First, a rollover top sets up, prompting a downward price trend to set up the sideways Flagging trend. After 4 to 8+ weeks of sideways Flagging, a broad downtrend will take place where price will fall -10% to -15% – targeting the CYAN support level near $29,000. Much like the NASDAQ, this critical support level is the last line of defense before a bigger breakdown in price may occur – possibly resulting in a very deep price correction.
Custom US Stock Market Index Chart Mirrors INDU
This final Custom US Stock Market Index Weekly chart, below, shows a similar type of setup as the INDU. These Custom Index charts are tools we use to help gauge the overall market trends and possible technical setups. They help to normalize price trends and variances between the major US indexes and provide a different perspective of price on a chart.
The first thing we notice when looking at this chart is that the Custom US Stock Market Index has yet to break the YELLOW upward price channel – just like the INDU chart. Secondly, we can see the Custom US Stock Market Index chart is much closer to the heavy MAGENTA Fibonacci Price Amplitude Arc than the INDU chart is – this suggests there may only be a 3% to 5% upside potential left in the markets related to any potential rally attempt. Readers need to understand this does not mean that markets are limited to +3% to +5% at this stage – many sectors may trend +10% or more while the Custom US Stock Market Index chart rallies only 1.5% or so. The stock market is a “market of stocks” – not a single entity related to the Custom US Stock Market Index chart. Therefore, we may see various rally ranges in various sectors while we see more muted trends in some of these major indexes.
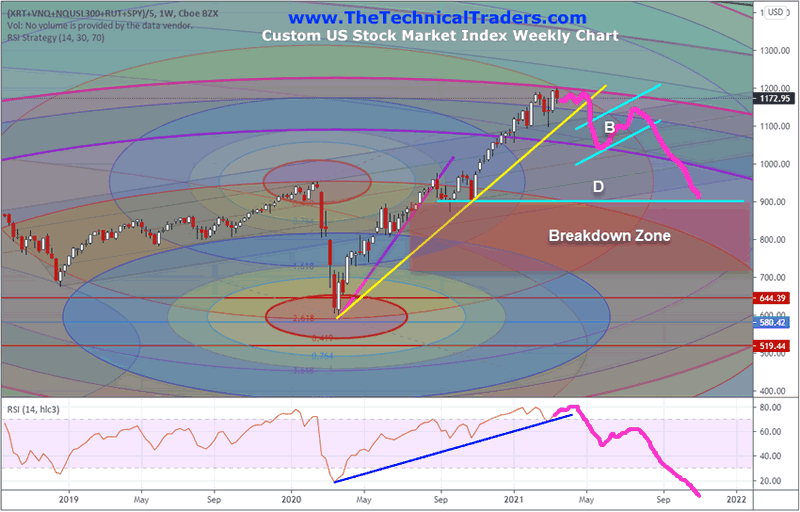
The last thing we want to point out on this chart is the Fibonacci Price Amplitude Arc that originates from February 2020 (pre-COVID-19 highs). It appears there is a high likelihood of a weakening uptrend on this chart after April 15, 2021. It also appears there is a likely APEX inflection point near May 5 through May 10. This APEX in price may become a key date for a potential breakdown in the trend on this Custom US Stock Market Index chart.
Overall, what we are seeing on this chart is that we have yet to break below the YELLOW upward price trend line and we are nearing the key Fibonacci Price Amplitude Arc levels – this suggests the markets may be nearing a period of consolidation and/or weakening upward price trending. The key to all of these setups is the process of the Excess Phase Peak setup – where price must complete the four phases (A through D) before finally attempting a larger breakdown event (#E).
Additionally, traders should stay keenly aware that various sectors will likely continue to trend in wide ranges with varying degrees of trend slopes while this extended pattern continues to setup. On this Custom US Stock Market Index chart, we are suggesting that the #C breakdown event (targeting #D), may take place in July or August 2021. This suggests we have about 3+ months of rotational sideways trending to navigate before the extended Excess Phase Peak #C breakdown event takes place.
As these trends continue to setup, we want you to understand how various opportunities for trend will continue to setup over the next few months in various sectors and indexes. These price rotations will likely prompt 8% to 25% price trends in a number of the best performing sectors and symbols. The key to finding and targeting this success is to know which sectors/trends are have the highest probability for success. That is what our Best Asset Now strategy does for us – it shows us when to engage with the market trends and which assets are the best performing assets to invest in.
Don’t miss the opportunities in the broad market sectors over the next 6+ months. 2021 and beyond are going to be incredible years for traders. What we expect to see is not the same type of market trend that we have experienced over the past 8+ years – this is a completely different set of market dynamics. You can sign up now for my FREE webinar that teaches you how to find, enter, and profit from only those sectors that have the most strength and momentum. Staying ahead of sector trends is going to be key to success in volatile markets.
For those who believe in the power of trading on relative strength, market cycles, and momentum but don’t have the time to do the research every day then my BAN Trader Pro newsletter service does all the work for you with daily market reports, research, and trade alerts. More frequent or experienced traders have been killing it trading options, ETFs, and stocks using my BAN Hotlist ranking the hottest ETFs, which is updated daily for my premium subscribers
Chris Vermeulen
www.TheTechnicalTraders.com
Chris Vermeulen has been involved in the markets since 1997 and is the founder of Technical Traders Ltd. He is an internationally recognized technical analyst, trader, and is the author of the book: 7 Steps to Win With Logic
Through years of research, trading and helping individual traders around the world. He learned that many traders have great trading ideas, but they lack one thing, they struggle to execute trades in a systematic way for consistent results. Chris helps educate traders with a three-hour video course that can change your trading results for the better.
His mission is to help his clients boost their trading performance while reducing market exposure and portfolio volatility.
He is a regular speaker on HoweStreet.com, and the FinancialSurvivorNetwork radio shows. Chris was also featured on the cover of AmalgaTrader Magazine, and contributes articles to several leading financial hubs like MarketOracle.co.uk
Disclaimer: Nothing in this report should be construed as a solicitation to buy or sell any securities mentioned. Technical Traders Ltd., its owners and the author of this report are not registered broker-dealers or financial advisors. Before investing in any securities, you should consult with your financial advisor and a registered broker-dealer. Never make an investment based solely on what you read in an online or printed report, including this report, especially if the investment involves a small, thinly-traded company that isn’t well known. Technical Traders Ltd. and the author of this report has been paid by Cardiff Energy Corp. In addition, the author owns shares of Cardiff Energy Corp. and would also benefit from volume and price appreciation of its stock. The information provided here within should not be construed as a financial analysis but rather as an advertisement. The author’s views and opinions regarding the companies featured in reports are his own views and are based on information that he has researched independently and has received, which the author assumes to be reliable. Technical Traders Ltd. and the author of this report do not guarantee the accuracy, completeness, or usefulness of any content of this report, nor its fitness for any particular purpose. Lastly, the author does not guarantee that any of the companies mentioned in the reports will perform as expected, and any comparisons made to other companies may not be valid or come into effect.
Chris Vermeulen Archive |
© 2005-2022 http://www.MarketOracle.co.uk - The Market Oracle is a FREE Daily Financial Markets Analysis & Forecasting online publication.