


GOLD GDX, HUI Stocks - Will Paradise Turn into a Dystopia?
Commodities / Gold and Silver Stocks 2021 May 11, 2021 - 01:52 PM GMTBy: P_Radomski_CFA

The GDX and HUI Index are enjoying a blissful moment. With HUI behaving civilly, will the GDX cling to the unrealistic and try to leap to cloud “ten”?
With the GDX ETF punching a hole through its glass ceiling, the senior miners are now witnessing an environment that’s beyond their wildest dreams: sunshine, clear skies and a utopia that’s eluded them since the beginning of the New Year. However, while leaving paradise is often more difficult than arriving, the GDX ETF’s recent vacation is likely coming to an end. And with the senior miners about to resume the daily grind of real life, their optimism will likely fade with the tropical sun.
To explain, while the GDX ETF remains on cloud nine, the HUI Index (a proxy for gold mining stocks ) has already left the resort. With the latter’s long-term outlook still intact and its broad head & shoulders pattern remaining on schedule, I wrote previously that the right shoulder would likely form after the HUI Index reaches 300. And after closing at 301.72 on May 7, the BUGS (after all, HUI is called the Gold Bugs Index) are currently living up to expectations.
Please see below:
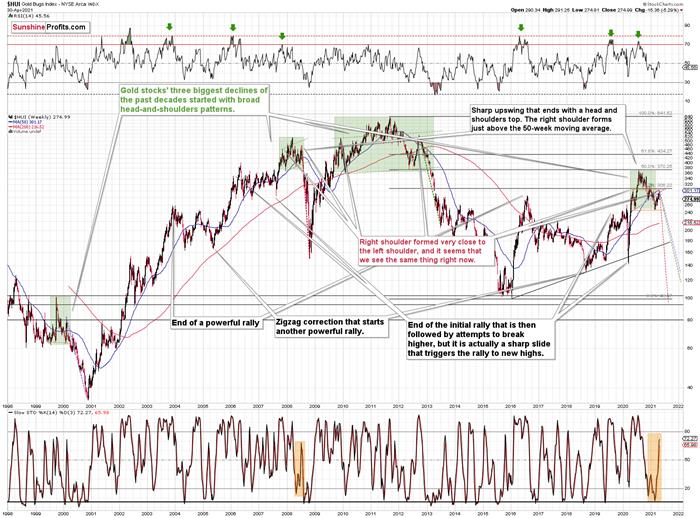
Moreover, while corrective short-term upswings within a medium-term downtrend can feel discouraging, it’s important to remember that similar instances occurred in 2008 and 2012. Remember: Tom Petty & The Heartbreakers warned us that the waiting is the hardest part. However, in the end, the wait should be more than worth it.
To explain, note that the 2007 – 2008 and the 2009 – 2012 head and shoulders patterns didn’t have the right shoulders all the way up to the line that was parallel to the line connecting the bottoms. I marked those lines with green in the above-mentioned formations. In the current case, I marked those lines with orange. Now, in both cases, the final top – the right shoulder – formed close to the price where the left shoulder topped. And in early 2020, the left shoulder topped at 303.02.
That’s why I previously wrote that “it wouldn’t be surprising to see a move to about 300 in the HUI Index”. And that’s exactly what we saw. To clarify, one head-and-shoulders pattern – with a rising neckline – was already completed, and one head-and-shoulders pattern – with a horizontal neckline – is being completed, but we’ll have the confirmation once miners break to new yearly lows.
For more context, I wrote previously:
The recent rally is not a game-changer, but rather a part of a long-term pattern that’s not visible when one focuses on the short-term only.
The thing is that the vast majority of individual investors and – sadly – quite many analysts focus on the trees while forgetting about the forest. During the walk, this might result in getting lost, and the implications are no different in the investment landscape.
From the day-to-day perspective, a weekly – let alone monthly – rally seems like a huge deal. However, once one zooms out and looks at the situation from a broad perspective, it’s clear that:
“What has been will be again, what has been done will be done again; there is nothing new under the sun.” (-Ecclesiastes 1:9)
The rally is very likely the right shoulder of a broad head and shoulders formation. “Very likely” and not “certainly”, because the HUI Index needs to break to new yearly lows in order to complete the pattern – for now, it’s just potential. However, given the situation in the USD Index (i.a. the positions of futures traders as seen in the CoT report , and the technical situation in it), it seems very likely that this formation will indeed be completed. Especially when (not if) the general stock market tumbles.
In addition, three of the biggest declines in the mining stocks (I’m using the HUI Index as a proxy here), all started with broad, multi-month head-and-shoulders patterns. And in all three cases, the size of the decline exceeded the size of the head of the pattern.
Can we see gold stocks as low as we saw them last year? Yes.
Can we see gold stocks even lower than at their 2020 lows? Again, yes.
Of course, it’s far from being a sure bet, but the above chart shows that it’s not irrational to expect these kind of price levels before the final bottom is reached. This means that a $24 target on the GDX ETF is likely conservative.
In addition, mining stocks are currently flirting with two bearish scenarios:
- If things develop as they did in 2000 and 2012-2013, gold stocks are likely to bottom close to their early 2020 high.
- If things develop like in 2008 (which might be the case, given the extremely high participation of the investment public in the stock market and other markets), gold stocks could re-test (or break slightly below) their 2016 low.
I know, I know, this seems too unreal to be true… But wasn’t the same said about silver moving below its 2015 bottom in 2020? And yet, it happened.
Keep in mind though: scenario #2 most likely requires equities to participate. In 2008 and 2020, the sharp drawdowns in the HUI Index coincided with significant drawdowns of the S&P 500 . However, with the words ‘all-time high’ becoming commonplace across U.S. equities, the likelihood of a three-peat remains relatively high.
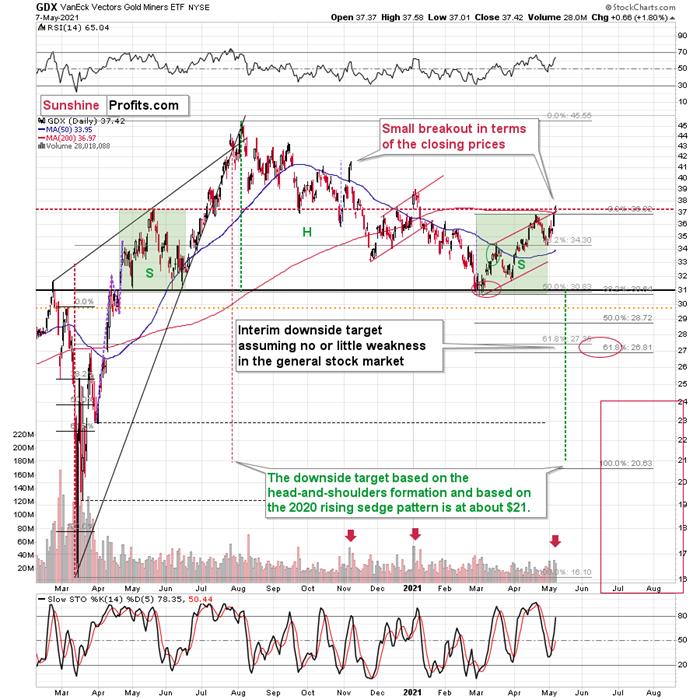
Circling back to the GDX ETF, on May 7, the senior miners inched closer to their May 2020 high. And while the development may seem bullish on the surface, the price action actually creates symmetry between the GDX ETF’s left and right shoulders. With May 2020’s peak occurring at nearly the same level, a move lower from here would only enhance the validity of the GDX ETFs H&S pattern.
On top of that, this is the third time that the GDX ETF has poked its head above the upper trendline of its roughly one-and-a-half-month channel. An ominous sign, the GDX ETF’s swoon in late 2020/early 2021, occurred precisely after the senior miners delivered their third act. Furthermore, a small breakout without confirmation is akin to a promise from a friend that can’t keep his word. Thus, with the GDX ETF still underperforming gold on a relative basis, it’s important to analyze the recent price action within its proper context.
Please see below:
For more context, I wrote on May 5:
The history might not repeat itself, but it does rhyme, and those who insist on ignoring it are doomed to repeat it. And there’s practically only one situation from more than the past four decades that is similar to what we see right now.
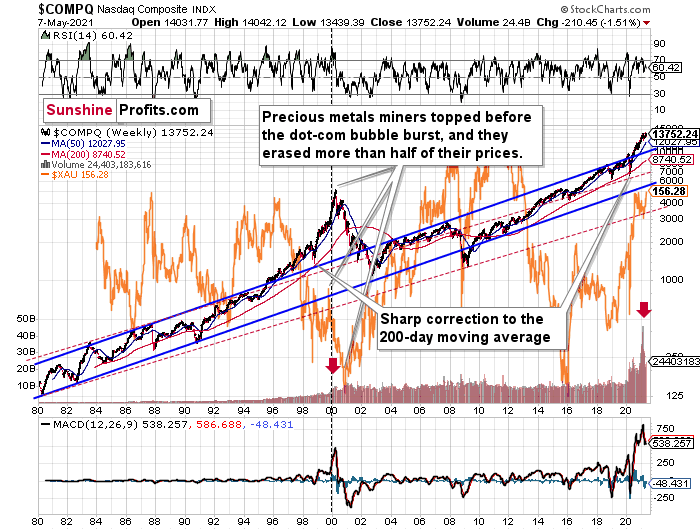
It’s the early 2000s when the tech stock bubble burst. It’s practically the only time when the tech stocks were after a similarly huge rally. It’s also the only time when the weekly MACD soared to so high levels (we already saw the critical sell signal from it). It’s also the only comparable case with regard to the breakout above the rising blue trend channel. The previous move above it was immediately followed by a pullback to the 200-week moving average, and then the final – most volatile – part of the rally started. It ended on significant volume when the MACD flashed the sell signal. Again, we’re already after this point.
The recent attempt to break to new highs that failed seems to have been the final cherry on the bearish cake.
Why should I – the precious metals investor care?
Because of what happened in the XAU Index (a proxy for gold stocks and silver stocks ) shortly after the tech stock bubble burst last time.
What happened was that the mining stocks declined for about three months after the NASDAQ topped, and then they formed their final bottom that started the truly epic rally. And just like it was the case over 20 years ago, mining stocks topped several months before the tech stocks.
Mistaking the current situation for the true bottom is something that is likely to make a huge difference in one’s bottom line. After all, the ability to buy something about twice as cheap is practically equal to selling the same thing at twice the price. Or it’s like making money on the same epic upswing twice instead of “just” once.
And why am I writing about “half” and “twice”? Because… I’m being slightly conservative, and I assume that the history is about to rhyme once again as it very often does (despite seemingly different circumstances in the world). The XAU Index declined from its 1999 high of 92.72 to 41.61 – it erased 55.12% of its price.
The most recent medium-term high in the GDX ETF (another proxy for mining stocks) was at about $45. Half of that is $22.5, so a move to this level would be quite in tune with what we saw recently.
And the thing is that based on this week’s slide in the NASDAQ that followed the weekly reversal and the invalidation, it seems that this slide lower has already begun.
“Wait, you said something about three months?”
Yes, that’s approximately how long we had to wait for the final buying opportunity in the mining stocks to present itself based on the stock market top.
The reason is that after the 1929 top, gold miners declined for about three months after the general stock market started to slide. We also saw some confirmations of this theory based on the analogy to 2008. Consequently, we might see the next major bottom – and the epic buying opportunity in the mining stocks – about three months after the general stock market tops. The NASDAQ might have already topped, so we’re waiting for the S&P 500 to confirm the change in the trend.
The bottom line?
New lows are likely to complete the GDX ETF’s bearish H&S pattern and set the stage for an even larger medium-term decline. And if the projection proves prescient, medium-term support (or perhaps even the long-term one) will likely emerge at roughly $21.
But why ~$21?
- The target aligns perfectly with the signals from the GDX ETF’s 2020 rising wedge pattern. You can see it in the left part of the above chart. The size of the move that follows a breakout or breakdown from the pattern (breakdown in this case) is likely to be equal (or greater than) the height of the wedge. That’s what the red dashed line marks.
- The target is also confirmed when applying the Fibonacci extension technique. To explain, if we take the magnitude of the GDX ETF’s recent peak-to-trough decline and extrapolate it by multiplying it by the Fibonacci sequence, the output results in a target adjacent to $21. I used the Fibonacci retracement tool to show that in the above chart. Interestingly, the same technique was useful in 2020 in order to time the March bottom.
- The broad head-and-shoulders pattern with the horizontal neckline at about $31 points to the $21 level as the likely target.
Likewise, when analyzing the situation through the lens of the GDXJ ETF, the junior miners are eliciting the same bearish signals. If you analyze the chart below, you can see that despite the recent strength, the GDXJ ETF is still trading below its medium-term rising support line (the thick black line below). More importantly, though, with the junior miners failing to reclaim this key level, their bearish H&S pattern remains intact.
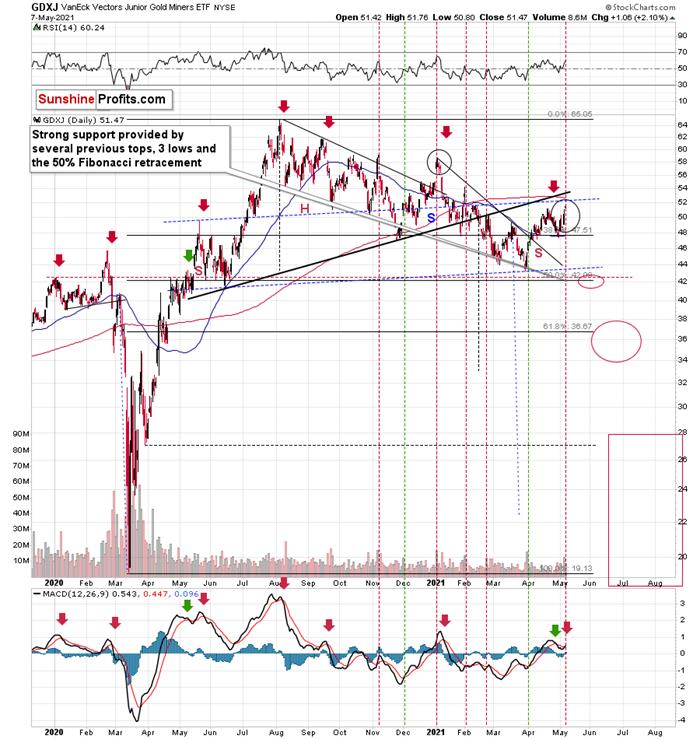
Even more ominous, the GDXJ ETF remains a significant underperformer of the GDX ETF. Despite sanguine sentiment and a strong stock market creating the perfect backdrop for the junior miners, the GDXJ ETF has failed to live up to the hype.
To explain, I wrote previously:
GDXJ is underperforming GDX just as I’ve been expecting it to. Once one realizes that GDXJ is more correlated with the general stock market than GDX is, GDXJ should be showing strength here, and it isn’t. If stocks don’t decline, GDXJ is likely to underperform by just a bit, but when (not if) stocks slide, GDXJ is likely to plunge visibly more than GDX.
Expanding on that point, the GDXJ/GDX ratio has been declining since the beginning of the year, which is remarkable because the general stock market hasn’t plunged yet. However, once the general stock market suffers a material decline, the GDXJ ETF’s underperformance will likely be heard loud and clear.
Please see below:
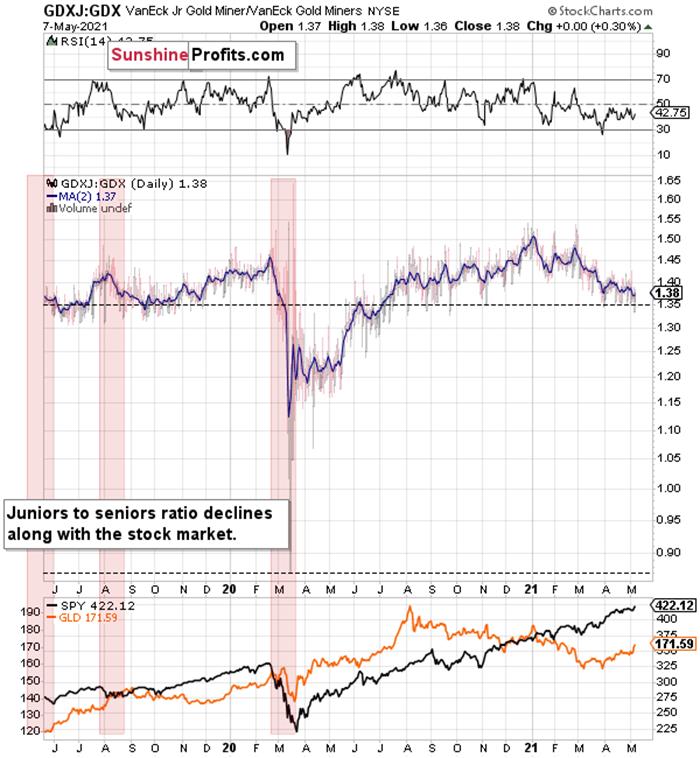
So, how low could the GDXJ ETF go?
Well, absent an equity rout, the juniors could form an interim bottom in the $34 to $36 range. Conversely, if stocks show strength, juniors could form the interim bottom higher, close to the $42.5 level. For context, the above-mentioned ranges coincide with the 50% and 61.8% Fibonacci retracement levels and the GDXJ ETF’s previous highs (including the late-March/early-April high in case of the lower target area). Thus, the S&P 500 will likely need to roll over for the weakness to persist beyond these levels.
Moreover, the HUI Index/S&P 500 ratio has recorded a major, confirmed breakdown. And with the ratio nowhere near recapturing its former glory, it’s another sign that a storm is brewing. Moreover, after moving back and forth for the last few months, not only has the HUI Index/S&P 500 ratio broken below its rising support line (the upward sloping black line below), but the ratio has also broken below the neckline of its roughly 12-month H&S pattern (the dotted red line below). As a result, given the distance from the head to the neckline, the HUI Index/S&P 500 ratio is on a collision course back to (at least) 0.050.
Please see below:
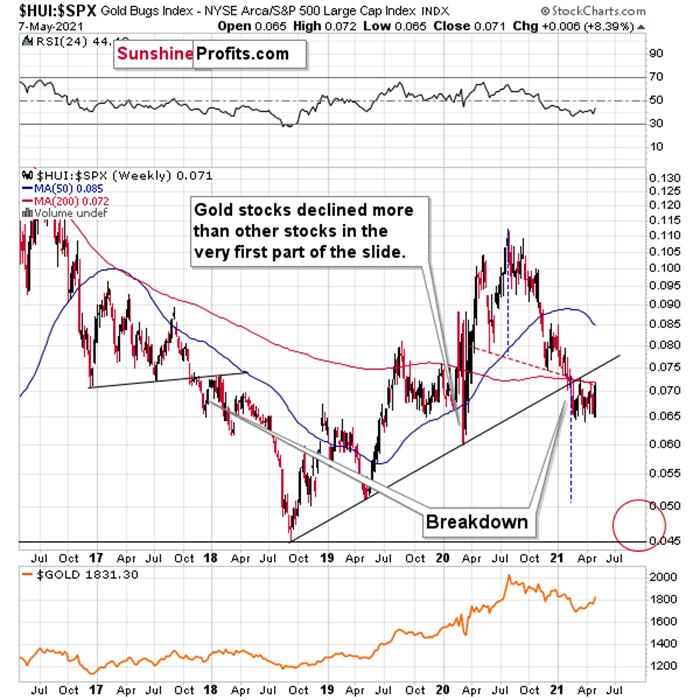
When the ratio presented on the above chart above is rising, it means that the HUI Index is outperforming the S&P 500. When the line above is falling, it means that the S&P 500 is outperforming the HUI Index. If you analyze the right side of the chart, you can see that the ratio has broken below its rising support line. For context, the last time a breakdown of this magnitude occurred, the ratio plunged from late-2017 to late-2018. Thus, the development is profoundly bearish.
Playing out as I expected, a sharp move lower was followed by a corrective upswing back to the now confirmed breakdown level (which is now resistance). Mirroring the behavior that we witnessed in early 2018, after breaking below its rising support line, the HUI Index/S&P 500 ratio rallied back to the initial breakdown level (which then became resistance) before suffering a sharp decline. And with two-thirds of the analogue already complete, the current move lower still has plenty of room to run. Likewise, the early-2018 top in the HUI Index/S&P 500 ratio is precisely when the USD Index began its massive upswing. Thus, with history likely to rhyme, the greenback could spoil the miners’ party once again.
In addition, the HUI to S&P 500 ratio broke below the neck level (red, dashed line) of a broad head-and-shoulders pattern, and it verified this breakdown by moving temporarily back to it. The target for the ratio based on this formation is at about 0.05 (slightly above it). Consequently, if the S&P 500 doesn’t decline, the ratio at 0.05 would imply the HUI Index at about 196. However, if the S&P 500 declined to about 3,200 or so (its late-2020 lows) and the ratio moved to about 0.05, it would imply the HUI Index at about 160 – very close to its 2020 lows.
All in all, the implications of mining stocks’ relative performance to gold and the general stock market are currently bearish.
But if we’re headed for a GDX ETF cliff, how far could we fall?
Well, there are three reasons why the GDX ETF might form an interim bottom at roughly ~$27.50 (assuming no big decline in the general stock market ):
- The GDX ETF previously bottomed at the 38.2% and 50.0% Fibonacci retracement levels. And with the 61.8% level next in line, the GDX ETF is likely to garner similar support.
- The GDX ETFs late-March 2020 high should also elicit buying pressure.
- If we copy the magnitude of the late-February/early-March decline and add it to the early-March bottom, it corresponds with the GDX ETF bottoming at roughly $27.50.
Keep in mind though: if the stock market plunges, all bets are off. Why so? Well, because when the S&P 500 plunged in March 2020, the GDX ETF moved from $29.67 to below $17 in less than two weeks. As a result, U.S. equities have the potential to make the miners’ forthcoming swoon all the more painful.
In conclusion, with gold, silver and mining stocks staying at the same springtime resort, their departure from reality implies plenty of jet lag at the end of their trip. And with the clock ticking, passengers boarding and their flight nearing takeoff, a return to real life is just around the corner. Moreover, with the USD Index long overdue for some R & R, a reversal of fortunes could leave the precious metals suffering severe envy. Thus, while gold, silver and mining stocks have enjoyed nothing but sun, sand and surf over the last few weeks, the pile of work that awaits them will likely keep them swamped over the medium term.
Thank you for reading our free analysis today. Please note that the above is just a small fraction of today’s all-encompassing Gold & Silver Trading Alert. The latter includes multiple premium details such as the target for gold that could be reached in the next few weeks. If you’d like to read those premium details, we have good news for you. As soon as you sign up for our free gold newsletter, you’ll get a free 7-day no-obligation trial access to our premium Gold & Silver Trading Alerts. It’s really free – sign up today.
Przemyslaw Radomski, CFA
Founder, Editor-in-chief
Tools for Effective Gold & Silver Investments - SunshineProfits.com
Tools für Effektives Gold- und Silber-Investment - SunshineProfits.DE
* * * * *
About Sunshine Profits
Sunshine Profits enables anyone to forecast market changes with a level of accuracy that was once only available to closed-door institutions. It provides free trial access to its best investment tools (including lists of best gold stocks and best silver stocks), proprietary gold & silver indicators, buy & sell signals, weekly newsletter, and more. Seeing is believing.
Disclaimer
All essays, research and information found above represent analyses and opinions of Przemyslaw Radomski, CFA and Sunshine Profits' associates only. As such, it may prove wrong and be a subject to change without notice. Opinions and analyses were based on data available to authors of respective essays at the time of writing. Although the information provided above is based on careful research and sources that are believed to be accurate, Przemyslaw Radomski, CFA and his associates do not guarantee the accuracy or thoroughness of the data or information reported. The opinions published above are neither an offer nor a recommendation to purchase or sell any securities. Mr. Radomski is not a Registered Securities Advisor. By reading Przemyslaw Radomski's, CFA reports you fully agree that he will not be held responsible or liable for any decisions you make regarding any information provided in these reports. Investing, trading and speculation in any financial markets may involve high risk of loss. Przemyslaw Radomski, CFA, Sunshine Profits' employees and affiliates as well as members of their families may have a short or long position in any securities, including those mentioned in any of the reports or essays, and may make additional purchases and/or sales of those securities without notice.
Przemyslaw Radomski Archive |
© 2005-2022 http://www.MarketOracle.co.uk - The Market Oracle is a FREE Daily Financial Markets Analysis & Forecasting online publication.