


Stock Market - Should You Be In Cash Right Now?
Stock-Markets / Stock Market 2021 May 17, 2021 - 10:03 AM GMTBy: Chris_Vermeulen

Sometimes there are very clear advantages to being in an all-cash position and avoiding the risks in the US/Global markets. For example, you should consider cash as a position when the markets begin to execute a broad market consolidation pattern that often results in many weeks or months of sideways, choppy price activity. You should also consider going to cash when a bigger shift in market trends takes place, putting your account at real risk should there be a 20% to 30%+ downside price trend setting up. Moving your assets away from these risks and into cash as early as possible can save thousands of dollars in unwanted – and worse yet totally avoidable – losses.
I know the rules of the game, and how everyone always says “it is better to ride out the trends and buy into the dips in the long run”. Well, we believe there is a better way to approach these bigger market trends that do not include riding out massive downside price trends – watching our wealth melt away as the markets collapse. We believe the purpose of actively managing your investments/trades should include a “cash position” as an active instrument in your portfolio. Why? Because moving your assets away from risks and into a cash position can often create a major advantage for all types of investors. We will get into more detail about this later.
First, we want to highlight the setup of the broad market cycle/trend and bring to your attention the unique similarities in certain symbols recently.
Understanding Broad Market Cycles
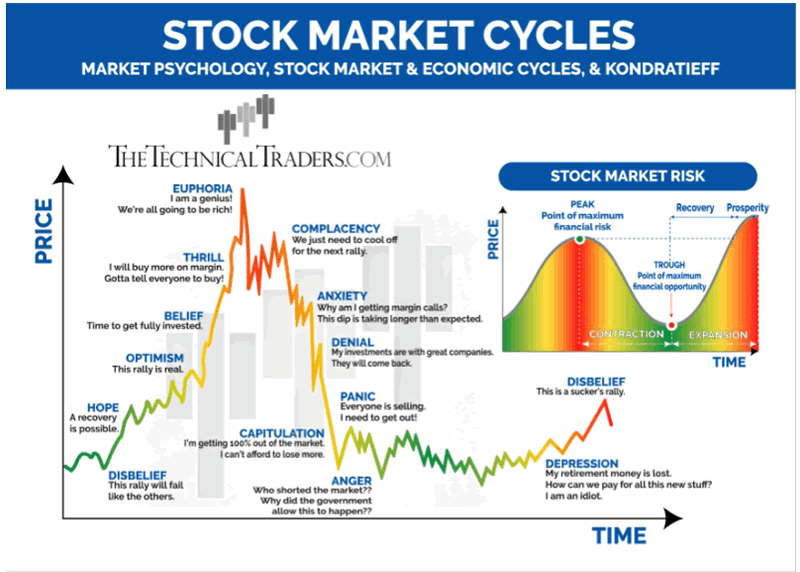
My research team and I are fairly confident you have seen a version of the following Stock Market Cycles graphic before. Yet surprisingly, many traders/investors forget to reference these broader market cycles when they focus on the short-term market trends. Often, traders get caught up in the excitement of the rally phase and forget to anticipate the peak, rollover, and breakdown phase that eventually comes into play.
Be sure to sign up for our free market trend analysis and signals now so you don’t miss our next special report!
My team and I believe the rally phase we’ve seen recently in the US stock market, certain global markets, cryptos, and commodities may have just completed the Belief, Thrill, and Euphoria rally phase – reaching what we’ve been calling an “Excess Phase Peak”. If our research is correct, we should expect to see a series of price patterns continue to play out over the next 2 to 6+ months that complete the Complacency, Anxiety, and Denial downward phases. We warned about this on November 27, 2020, in our research report entitled ‘How to spot the end of an Excess Phase’.
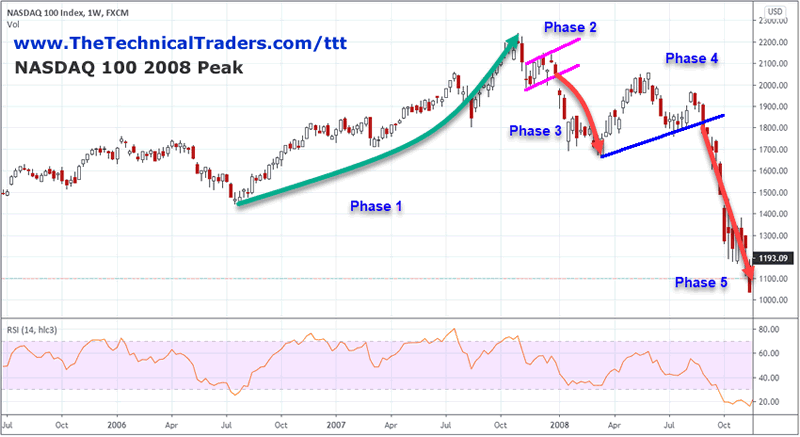
In that research report, we shared our understanding of the breakdown setup and the 5 phases that typically process through the Euphoria, Complacency, Anxiety, and Denial phases. In our Excess Phase Peak example below where we look at the NASDAQ’s 2008 peak, we have labeled these phases as follows:
- The rally to the peak – Euphoria
- The initial breakdown and sideways FLAG in price – the Complacency Peak
- The breakdown to critical support – Anxiety Phase
- The extended sideways trending before the eventual breakdown of critical support – transition into the Denial Phase
- An finally the ultimate bottom sets up eventually – Denial & Panic Phases
The Benefits Of Developing CASH As A Viable Trading Position
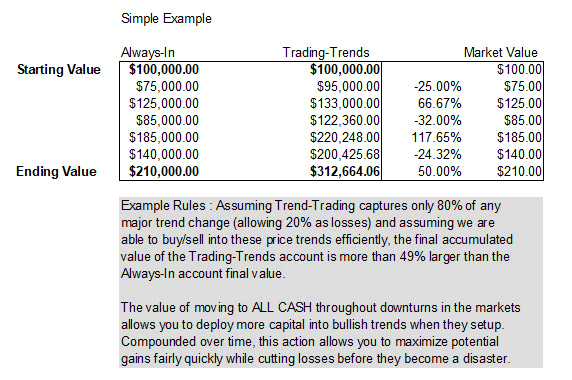
Take a look at the following example accounts that compare between staying invested in varying trends vs. rolling in and out of the market throughout broad market trends. In this example, the “Always-In” keeps the initial $100k investment fully allocated throughout bullish and bearish trends. The “Trading-Trends” rolls capital in and out of the market trends (giving up 20% of each trend before altering allocation levels) and continues to reinvest the full capital into new bullish trends. The difference is staggering – almost 50% more in total returns than the “Always-In” strategy.
As markets start to churn and start a new phase, you will undoubtedly hear from different advisors and financial gurus about how you should best manage your assets. In our opinion, any form of more active, protective price trend management is better than leaving your decisions up to another individual or chance. If you are able to dedicate a few hours a week to watch the markets, understanding these broad market trends, and finding a good mentor to help you make sense of what’s happening in the markets, you can learn to outperform the S&P consistently.
As we’ve been suggesting for many months, the next few years are going to be full of incredible opportunities for traders and investors. Smart traders will quickly identify these phases of the market and will understand how to position themselves to take advantage of this next phase. You can learn more about how I identify and trade Gold, Silver, and the markets by watching my FREE step-by-step guide to finding and trading the best sectors.
For those who believe in the power of trading on relative strength, market cycles, and momentum but don’t have the time to do the research every day then my BAN Trader Pro newsletter service does all the work for you with daily pre-market reports, proprietary research, and trade alerts. More frequent or experienced traders have been killing it trading options, ETFs, and stocks using my BAN Hotlist ranking the hottest ETFs, which is updated daily for my premium subscribers. Sign up today!
In Part II of this article, we’ll highlight three very important charts that very clearly show we may be transitioning into the Complacency and Anxiety phases of the broad market trends (or into Phase 2 & 3 of the Excess Phase Peak transition). If this pattern continues to play out as we expect, traders and investors could be nearing a major decision-making process regarding how to protect wealth, what to do next and where should I find the right answers to all my questions?
Chris Vermeulen
www.TheTechnicalTraders.com
Chris Vermeulen has been involved in the markets since 1997 and is the founder of Technical Traders Ltd. He is an internationally recognized technical analyst, trader, and is the author of the book: 7 Steps to Win With Logic
Through years of research, trading and helping individual traders around the world. He learned that many traders have great trading ideas, but they lack one thing, they struggle to execute trades in a systematic way for consistent results. Chris helps educate traders with a three-hour video course that can change your trading results for the better.
His mission is to help his clients boost their trading performance while reducing market exposure and portfolio volatility.
He is a regular speaker on HoweStreet.com, and the FinancialSurvivorNetwork radio shows. Chris was also featured on the cover of AmalgaTrader Magazine, and contributes articles to several leading financial hubs like MarketOracle.co.uk
Disclaimer: Nothing in this report should be construed as a solicitation to buy or sell any securities mentioned. Technical Traders Ltd., its owners and the author of this report are not registered broker-dealers or financial advisors. Before investing in any securities, you should consult with your financial advisor and a registered broker-dealer. Never make an investment based solely on what you read in an online or printed report, including this report, especially if the investment involves a small, thinly-traded company that isn’t well known. Technical Traders Ltd. and the author of this report has been paid by Cardiff Energy Corp. In addition, the author owns shares of Cardiff Energy Corp. and would also benefit from volume and price appreciation of its stock. The information provided here within should not be construed as a financial analysis but rather as an advertisement. The author’s views and opinions regarding the companies featured in reports are his own views and are based on information that he has researched independently and has received, which the author assumes to be reliable. Technical Traders Ltd. and the author of this report do not guarantee the accuracy, completeness, or usefulness of any content of this report, nor its fitness for any particular purpose. Lastly, the author does not guarantee that any of the companies mentioned in the reports will perform as expected, and any comparisons made to other companies may not be valid or come into effect.
Chris Vermeulen Archive |
© 2005-2022 http://www.MarketOracle.co.uk - The Market Oracle is a FREE Daily Financial Markets Analysis & Forecasting online publication.