


S&P 500 Stock Market Rally – Are We Nearing The Top?
Stock-Markets / Stock Market 2021 Jul 06, 2021 - 03:28 PM GMTBy: Chris_Vermeulen

Are the US stock markets poised for a reversion price event in the near future? My research team and I believe $4400 on the S&P 500 may be a key psychological level that many traders are unaware of in the immediate term. Some very interesting Fibonacci and Gann dynamics are at play as we watch the excess rally phase continue to drive markets higher. Will the Q2:2021 earning season prompt a blow-off top setup or will the markets continue to rally higher? Continue reading to learn why we are cautious of the $4400 level on the S&P 500 and why you may want to prepare for a moderately big volatility event if our research is correct.
There are a number of key technical components to our research related to the $4400 target peak level for the S&P 500. First, the Fibonacci correlation to the rally phases that have taken place throughout the bullish price waves (1-3-5) since the 2009 bottom. We’ll get to that in a minute. Second, we believe our Gann cycle phase research and Fibonacci Price Amplitude Arc research suggests the current market rally is very over-extended to the upside. In other words, we believe this excessive upside price trending is likely to revert, quite strongly, at some point in the near future.
Be sure to sign up for our free market trend analysis and signals now so you don’t miss our next special report!
The $4400 number becomes our key focus for two reasons. Based on our research, that level appears to hold significant resistance and the fact that the S&P 500 will likely reach this $4400 level within the next few days/weeks prompts an urgency for us to share this information with our readers.
As we continue to present charts and research, ask yourself this one simple question: if one were to take place over the next few weeks, are you prepared for a moderately large price reversion event with regards to protecting your trades and understanding the risks? Would you be shocked if the S&P 500 collapsed to levels near $330 (or lower) after reaching $440 (representing a -25% price reversion)? Let’s explore this concept to help you prepare – just in case.
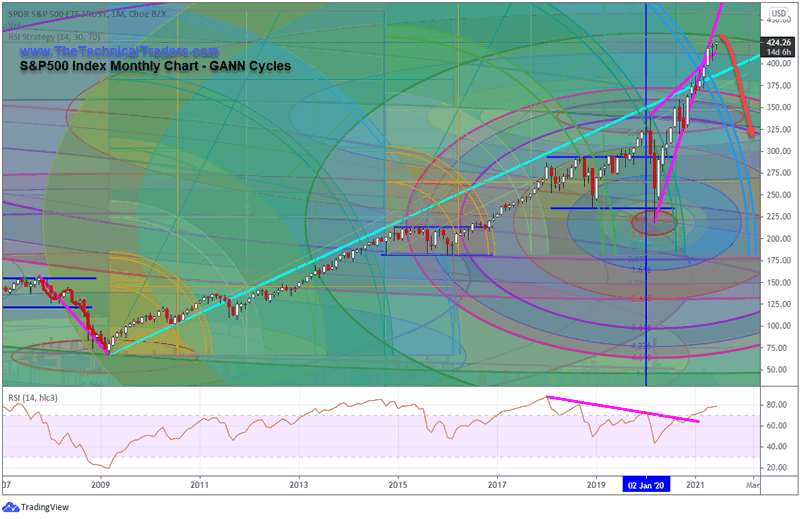
Custom US Stock Market Index Suggests $440 Is Likely Strong Resistance
In this first Custom US Stock Market Index Monthly chart, we are watching the $440 level as key resistance (which you can see from the GREEN Fibonacci Price Amplitude Arc near the current price highs). This $440 level represents a similar price level to the $4400 level on the S&P 500 chart (below).
You can also see the Gann Arcs that we’ve drawn on this chart with the most recent levels being near $380 (in LIGHT BLUE) on this chart. This broad Gann Price arc suggests that a key price inflection point took place between March and May 2021. It is our belief that the exuberant rally phase that continues to drive the market price higher has overrun this price inflection point and extended beyond moderate resistance. This sets up a possibility that a reversion price event may prompt a bigger correction in price, possibly reverting back to the Gann inflection point targets – near $325 on this chart.
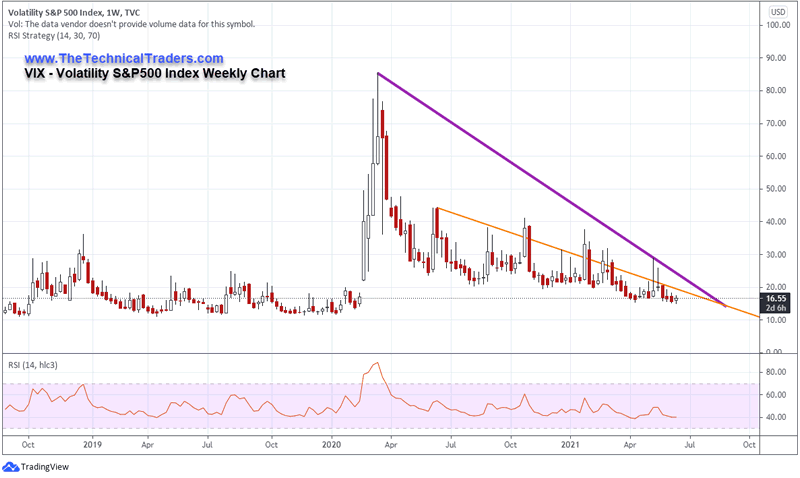
VIX Settling Near 15 May Prompt A Volatility Event If The Market Roll Over
The VIX moving in a consolidated lower price trend suggests traders have become very complacent recently. Even though volatility in the markets is still 2x to 3x normal ranges, the VIX is reflecting lower levels similar to the 1x type of volatility we saw before 2018. This happens because the VIX is calculated using a smoothing function related to the “near-term” and “next-term” options data (source: VIX Calculation Explained).
We believe it is quite likely that a surprise Q2:2021 volatility event will take place over the next few weeks, possibly aligned with the $4400/$440 price targets we are suggesting, that may prompt a larger price reversion event to the downside and prompt the VIX to move above 40~45 again.
If our research is correct, this type of correction in the market may surprise traders simply because many traders have become very complacent with the seemingly un-ending upward price trending. If you take a quick look at the Custom US Stock Market Index chart, above, you’ll see how strong and aggressive the current upside price trending has become. At this stage, we could safely call this upward price trend “near vertical” and hyper-parabolic.
The Bigger Elliot Wave Setup Suggests We Are Rallying To A Wave 5 Peak – Get Ready For The Next Big Wave Lower
Traders need to continually adopt a varying perspective related to the broader markets and trends. The shorter-term trends may be showing us what to expect over a few days or weeks, but the longer-term trend can help us identify trends that may last months or years.
The technical charts, above, are all based on Weekly and Monthly charts because we wanted to highlight the varying technical (Price, Fiboancci and Gann) setups that we believe may conjoin at some point over the next few weeks to prompt a reversion event. Although we can’t time this event to the day/week, we are actively watching our technical systems/strategies for signs that the markets have exhausted this upward trend and we believe the potential reversion could be sudden and violent (if it happens).
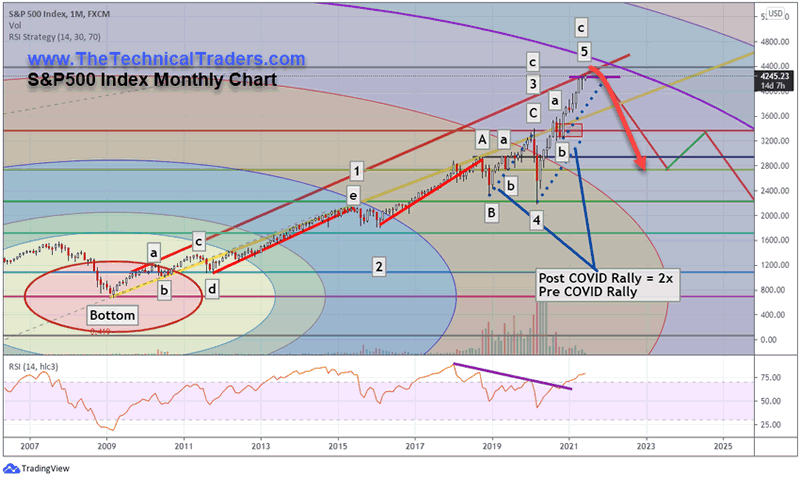
This last chart is a Monthly S&P 500 Index chart showing our analysis of the current Elliot Wave structure. We believe the current rally is a Wave 5 rally to a peak – which may be very close to reaching the apex levels – or reaching a critical top. Our analysis of the 2x Wave 5 rally, shown on the chart, is rooted in the premise that the 2015 to 2020 rally represented the end of wave 3 and the COVID collapse represented a very quick Wave 4 correction. Currently, our Wave 5 peak expectation for price is near $4400 on the S&P 500.
The S&P 500 is currently trading just above $4325 and is closing in on the $4400 level fairly quickly. The importance of this $4400 level is critical to understand in the sense that it represents a key psychological level and also aligns with the PURPLE arcing Fibonacci Price Amplitude Arc on the chart below. This Fibonacci Price Amplitude Arc originates from the 2009 market bottom and represents a 3.618 total price expansion.
What makes us believe our analysis is accurate is that the move from the 2009 bottom to the Wave 1 peak totaled approximately 1459 points. The move from the bottom of Wave 2 to the Peak at Wave 3 totaled approximately 1594 points (larger than Wave 1: 1.0925%). The current Wave 5 rally, if it ends near $4400, would represent a rally of 2200 points (the largest Wave: representing a 1.507% expansion of Wave 1 and a 1.380% expansion of Wave 3). The alignment of key Fibonacci ratios suggesting the $4400 level will become a critical peak for the S&P 500 Index tells us our analysis is likely to be correct. It also suggests the markets are very close to a critical peak level and all traders need to be aware of this setup.
Our belief that a reversion event and/or a critical market top is pending should not surprise you at this point – we are simply riding out this “rally to a peak” trend while we wait for confirmation of a major trend reversal. If the $4400 level on the S&P500 does not confirm as a major peak, then we will simply wait for the next higher peak level to setup.
Please note that we are not trying to pick a top or suggest traders jump into short positions because of our research. We are suggesting that traders pay very close attention to how the markets react after the S&P500 reaches near the $4400 level as we believe price levels may stall and begin to roll downward – possibly starting a bigger reversion event from this peak level.
Traders want to stay ahead of these trends and opportunities related to what may become the next big disruptive technology gains. As we move further into the 21st Century, it is very likely that space will become the DOT COM/Internet disruptive technology over the next 20 to 40+ years (or longer). That means traders need to start considering how this exciting new sector fits into their investment portfolio and where new industry leaders will settle.
My team and I have been building and developing fully systematic algorithmic trading strategies for many years and can tell you that unless you have a solid foundation related to knowing when and where opportunities exist in market trends, you are likely churning your money in and out of failed trades. I will be presenting my two favorite strategies at the July Wealth365 Summit on July 13th at 4 pm and July 16th at 12 pm. The Summit is free to attend and offers unparalleled opportunities for learning…plus a potential prize or two!
Want to know how our BAN strategy is identifying and ranking various sectors and ETFs for the best possible opportunities for future profits? Please take a minute to learn about my BAN Trader Pro newsletter service and how it can help you identify and trade better sector setups. My team and I have built this strategy to help us identify the strongest and best trade setups in any market sector. Every day, we deliver these setups to our subscribers along with the BAN Trader Pro system trades. You owe it to yourself to see how simple it is to trade 30% to 40% of the time to generate incredible results.
Have a great day!
Chris Vermeulen
www.TheTechnicalTraders.com
Chris Vermeulen has been involved in the markets since 1997 and is the founder of Technical Traders Ltd. He is an internationally recognized technical analyst, trader, and is the author of the book: 7 Steps to Win With Logic
Through years of research, trading and helping individual traders around the world. He learned that many traders have great trading ideas, but they lack one thing, they struggle to execute trades in a systematic way for consistent results. Chris helps educate traders with a three-hour video course that can change your trading results for the better.
His mission is to help his clients boost their trading performance while reducing market exposure and portfolio volatility.
He is a regular speaker on HoweStreet.com, and the FinancialSurvivorNetwork radio shows. Chris was also featured on the cover of AmalgaTrader Magazine, and contributes articles to several leading financial hubs like MarketOracle.co.uk
Disclaimer: Nothing in this report should be construed as a solicitation to buy or sell any securities mentioned. Technical Traders Ltd., its owners and the author of this report are not registered broker-dealers or financial advisors. Before investing in any securities, you should consult with your financial advisor and a registered broker-dealer. Never make an investment based solely on what you read in an online or printed report, including this report, especially if the investment involves a small, thinly-traded company that isn’t well known. Technical Traders Ltd. and the author of this report has been paid by Cardiff Energy Corp. In addition, the author owns shares of Cardiff Energy Corp. and would also benefit from volume and price appreciation of its stock. The information provided here within should not be construed as a financial analysis but rather as an advertisement. The author’s views and opinions regarding the companies featured in reports are his own views and are based on information that he has researched independently and has received, which the author assumes to be reliable. Technical Traders Ltd. and the author of this report do not guarantee the accuracy, completeness, or usefulness of any content of this report, nor its fitness for any particular purpose. Lastly, the author does not guarantee that any of the companies mentioned in the reports will perform as expected, and any comparisons made to other companies may not be valid or come into effect.
Chris Vermeulen Archive |
© 2005-2022 http://www.MarketOracle.co.uk - The Market Oracle is a FREE Daily Financial Markets Analysis & Forecasting online publication.