


Stock Market Intermediate Top Reached
Stock-Markets / Stock Market 2021 Aug 02, 2021 - 05:08 PM GMTBy: Andre_Gratian

Current Position of the Market
SPX Long-term trend: There is some evidence that we are still in the bull market which started in 2009 and which could continue into 2021 until major cycles take over, and it ends. A move up to ~4500 is possible before the current bull market makes a final top and SPX corrects into its next major cycle low due in 2023.
SPX Intermediate trend: SPX has now reached its next intermediate top.
Analysis of the short-term trend is done daily with the help of hourly charts. They are important adjuncts to the analysis of daily and weekly charts which determine longer market trends.
Intermediate Top Reached
Cycles: Looking ahead!
7-yr cycle – Last lows: 2009-2016. Next low: ~2023
Market Analysis (Charts, courtesy of StockCharts)
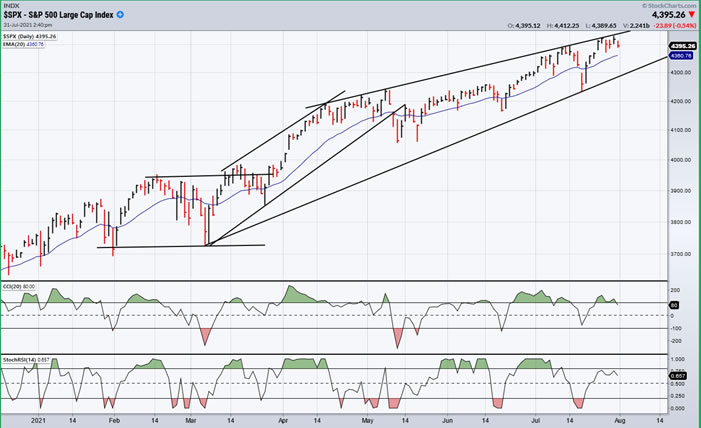
SPX daily chart
The daily chart below is providing us with a clear picture of what the market is doing! Between February and March of this year, the index underwent an intermediate consolidation phase above 3700, the second one since the March 2020 low of 2200. When the consolidation was over, the index first drove slightly above its consolidation high, pulled back for a couple of weeks, and kept on going. At first, the advance was steep, as you can see illustrated by the first bullish channel; then, after a minor consolidation, it settled into a more moderate uptrend which, after five months of a steady rise, seems to be getting a little tired -- and for good reasons!
In May, the indicators alerted us to the first important correction in the uptrend. Now, they are telling us to be cautious by again displaying negative divergence, except that this time what lies ahead is not simply a minor correction in the uptrend followed by a change in the angle of ascent. This time they are warning us that the end of the entire uptrend is imminent! We know this because the move has now almost expanded its full potential which, according to the base formed on the Point & figure chart in February-March, resulted in a pattern which projected a move to ~4440.
Last week, SPX rose to 4423 before finding sellers. After a bout of profit taking, it recovered and moved a little higher coming within pennies of 4430 before running into selling again. This action attests to the validity of the projection to 4440 which may or may not be reached on what will probably be the third and final try next week.
I have already mentioned that the P&F base created during the March 2020 low gave us a pattern which could be analyzed phase by phase, each projecting a level at which the index was likely to consolidate before continuing to its final destination deemed to be ~4550. The next to the last phase had given us a count to at least 4310-4350. But the re-accumulation pattern across the 3723-base (because it is more recent and therefore more reliable) projected a rise to 4440, a target not too inconsistent with the base target.
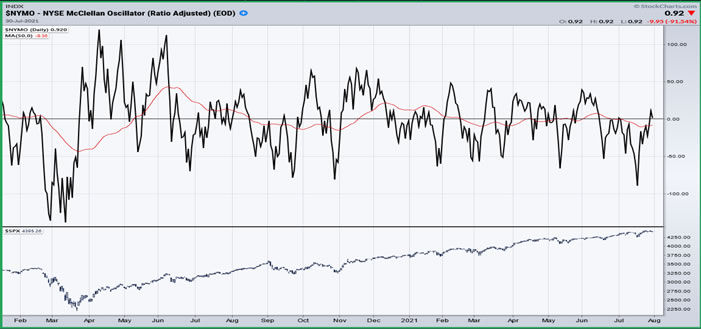
The next chart below shows the performance of the McClellan Oscillator (breadth indicator) relative to SPX since the March 2020 low. After the initial surge of buying which took place at the low, the indicator shows a clear pattern of deterioration as less and less individual issues remain in a bullish trend. The last negative probe of the indicator, which corresponds with the mid-July low, reached the deepest level since March ’20, and the rally which followed barely became positive before turning down again. You don’t have to be a skilled analyst to deduce that this spells trouble for the market, confirming what we discussed in the previous segment.
-
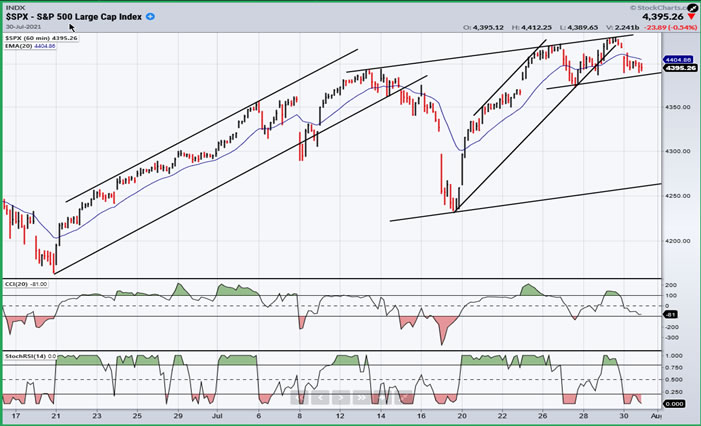
- SPX hourly chart
- If you did not find the analysis of the daily chart compelling enough, take a look at what the hourly chart is doing! The short-term trend of the market is governed by a short-term cycle which is well represented on the chart below. A complete phase of that cycle spans the period between June 21 and July 20. The next phase looks far weaker, with the index already clearly struggling to stay in an uptrend. Whereby the first cycle remained in a narrow channel for most of its uptrend, the current one has already moved out of it and does not look capable of reinstating its uptrend. It has already tried once and failed, and if the index breaks out of the narrow horizontal channel on the downside, it risks declining for the remainder of the cycle’s phase which is still several days away. Furthermore, because this is likely to be an intermediate top, this could be the first of several short-term cycle phases in a downtrend.
- Combine this with the fact that the index is now trading within a few points of its projected target and the negative divergence exhibited by the daily momentum indicators (CCI,SRSI), and that which shows in the breadth indicator (McClellan), and you can deduce that a risk-off approach may be the best at this time.
-
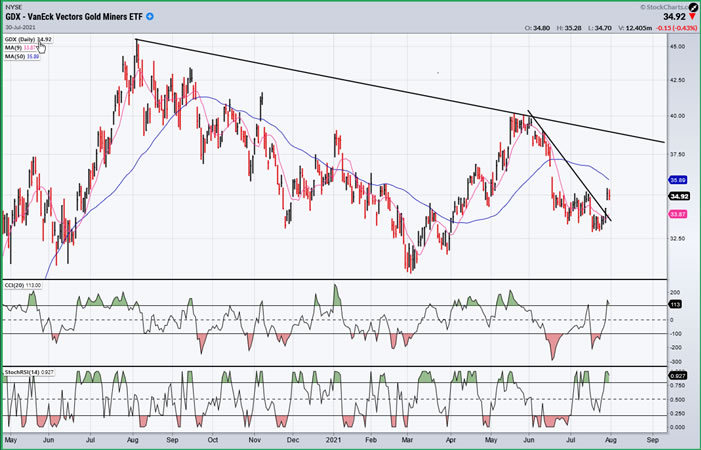
- GDX (gold miners) (dly)
- GDX did break out of its short-term secondary trend line but does not have a large enough base created at the recent low to provide a sustained move. If it can alternate between 34 and 35 over the next few weeks, it could expand that base for a move back to the primary downtrend line.
-
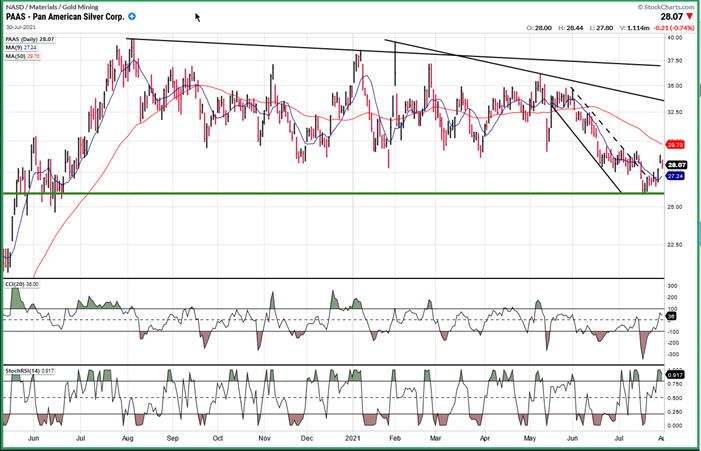
- PAAS (dly)
- PAAS is essentially in the same position as GDX and would have to move above 30 to get out of its base.
-
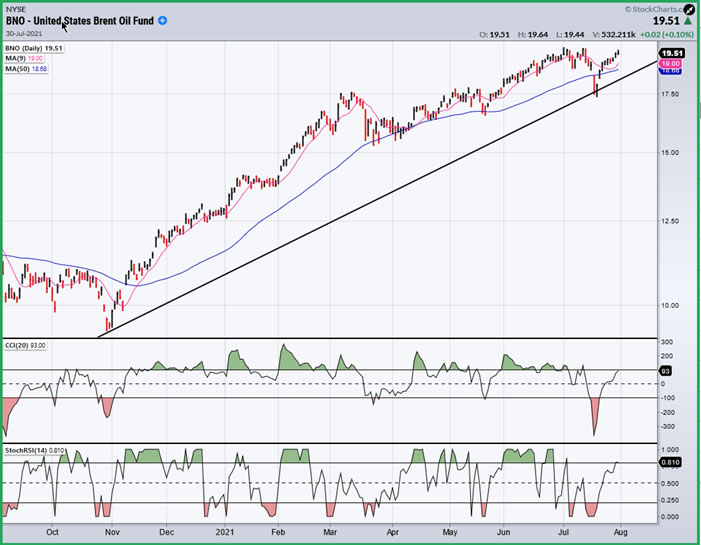
- BNO (Brent oil fund) dly
- BNO corrected, found support on its trend line, and is retesting its high. If it turns back down, a close below its 50-dma could lead to an extensive correction.
-
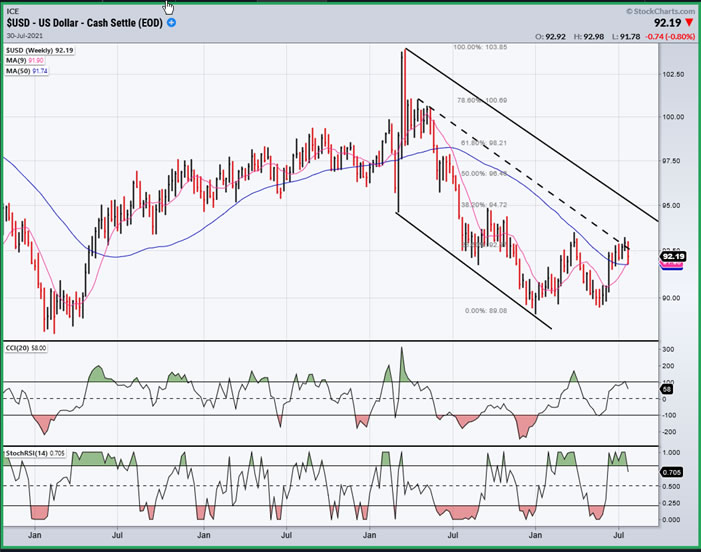
- USD (dollar) dly
- The dollar found resistance at a former short-term high and pulled back. It looks as it if wants to go higher and challenge its corrective channel line.
-
- SUMMARY
- SPX is approaching an intermediate top which could bring about a lengthy correction, perhaps back down to ~4050.
Andre
NOTE: I have a new email: agratianj@gmail.com
Free trial subscription
With a trial subscription, you will have access to the same information that is given to paid subscribers, but for a limited time-period. Over the years, I have developed an expertise in P&F charting (price projection), cycles (timing), EWT (structure), and general technical analysis which enables me to warn subscribers of pending reversals in market trends and how far that trend can potentially carry. For a FREE 2-week trial, subscription options and payment plans, I encourage you to visit my website at www.marketurningpoints.com.
Disclaimer - The above comments about the financial markets are based purely on what I consider to be sound technical analysis principles uncompromised by fundamental considerations. They represent my own opinion and are not meant to be construed as trading or investment advice, but are offered as an analytical point of view which might be of interest to those who follow stock market cycles and technical analysis.
Andre Gratian Archive |
© 2005-2022 http://www.MarketOracle.co.uk - The Market Oracle is a FREE Daily Financial Markets Analysis & Forecasting online publication.