


Financial System Liquidity Alarm
Stock-Markets / Financial Crisis 2021 Aug 15, 2021 - 05:24 PM GMTBy: Gary_Tanashian

Market liquidity is draining from different vantage points
On Wednesday I made a post that showed the “metallic credit spread” (as coined by Bob Hoye) known as the Gold/Silver ratio (GSR) flipped on its head (to Silver/Gold) to indicate a dangerous situation for the S&P 500, if past is prologue. Here is that post and here is the Tweet that followed…
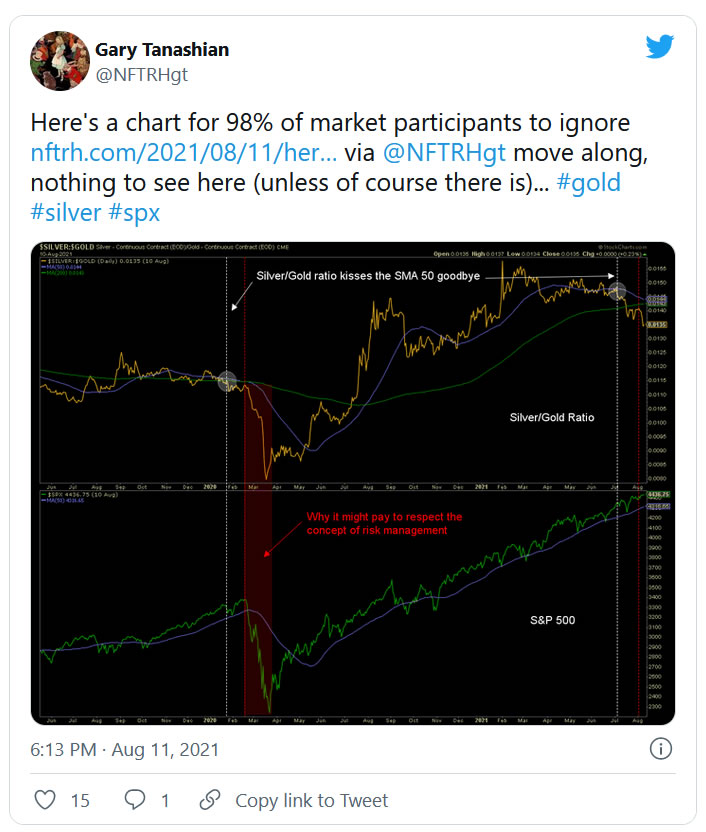
Silver, with more cyclical inflation-sensitive characteristics than gold (which is more counter-cyclical with utility during liquidity crises) has broken down of late vs. its monetary daddy. The chart speaks for itself as to why caution and risk management are now warranted.
Let’s add a couple other indicators to the case for a coming negative liquidity event and as a knock-on effect, eventual failure of the current inflation trades that have casino patrons far and wide lathered up about the big time inflation the Fed created in 2020.
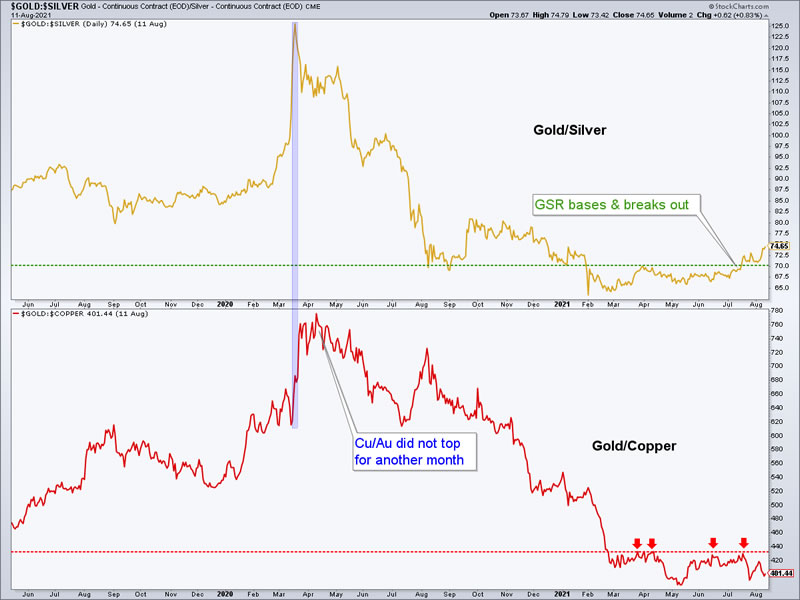
First, let’s address a situation noted by an NFTRH subscriber where the Gold/Copper ratio (GCR) is not confirming the Gold/Silver ratio’s rise.
The reason I use the Gold/Silver ratio to look forward beneath the market’s surface is its relative sensitivity to inflation/deflation, liquidity/illiquidity. As you can see, amid the COVID crisis of 2020 both the GSR and the GCR ramped upward, as would be logically expected during a negative liquidity event. But our early indicator to the coming whopper of an inflation (as manufactured by the Fed) was the blow out and top in the GSR. GCR did not top for another month. So today’s negative divergence to the bullish breakout in the GSR is logical from that perspective.
Casino patrons are happily still playing in the House of the Fed’s Rising Sun as a warning whirs along beneath them.
Moving on to a couple of other indicators, note Steve Saville’s view of the YoY crash in the TMS (monetary inflation) rate. This and the other global views he presents in this post are still positive, although the inflation rates are tanking. There is still liquidity in the markets (and economy), but the trend is going the wrong way for bullish, inflationist casino patrons.
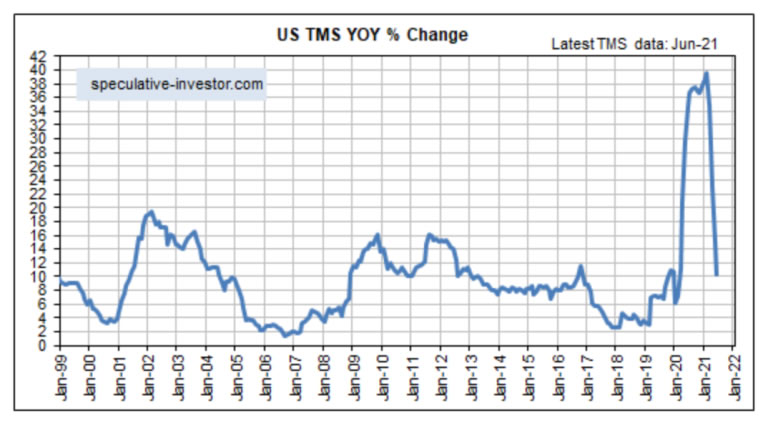
He concludes…
“We’ve written previously that the H1-2021 global monetary inflation reversal probably won’t be a major driver of prices over the balance of this year. This is due to the time it takes for a change in the money-supply growth trend to ‘ripple through’ the financial markets and the economy. However, unless the Fed and the ECB generate a new monetary tsunami over the next several months, the G2 monetary inflation rate could become low enough by early next year to set off a boom-to-bust transition.”
Of course, the Fed and other CBs could “generate a new monetary tsunami” at any time and indeed, my Continuum chart (at the end of the article) has allowed for that and still does allow for that. So the question is whether or not the Fed will see and and take active measures to forestall the coming liquidity crunch. Don’t underestimate their ability to screw up a perfectly good liquidity crisis.
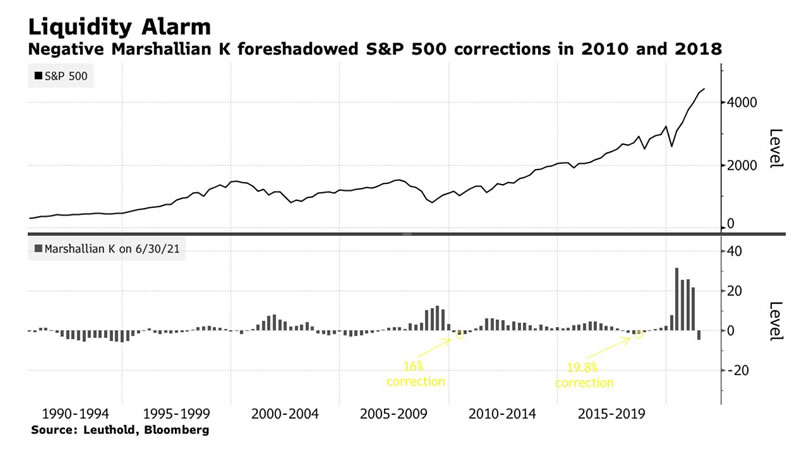
But back on the main theme of this post, an indicator I’ve never heard of, a “liquidity alarm” known as Marshallian K, as presented at Bloomberg by way of an NFTRH subscriber is going off.
Liquidity Is Evaporating Even Before Fed Taper Hits Markets (as reprinted at Yahoo)
The signal is obscure, but has sent meaningful signs in the past. Roughly speaking, it’s the gap between the rates of growth in money supply and gross domestic product, an indicator known to eco-geeks as Marshallian K. It just turned negative for the first time since 2018, meaning GDP is rising faster than the government’s M2 account.
The shortfall comes from an expanding economy that’s quickly depleting the nation’s available money. The deficit could become a problem for markets at a time when excess liquidity is seen as underpinning rallies in everything from Bitcoin to meme stocks.
However…
The Leuthold study is the latest attempt to handicap the market’s outlook from the perspective of liquidity. But not everyone is worried. Ed Yardeni, the president and founder of Yardeni Research Inc., says he prefers to plot not the growth rates but the absolute level of M2 against GDP to measure liquidity. Based on that, liquidity stood near a record high.
“Some people start to freak out about the M2 growth rate,” he said in an interview on Bloomberg TV and Radio. “What they don’t really appreciate is M2 today is $5 trillion higher than it was before the pandemic. There is just a tremendous liquidity sitting there.”
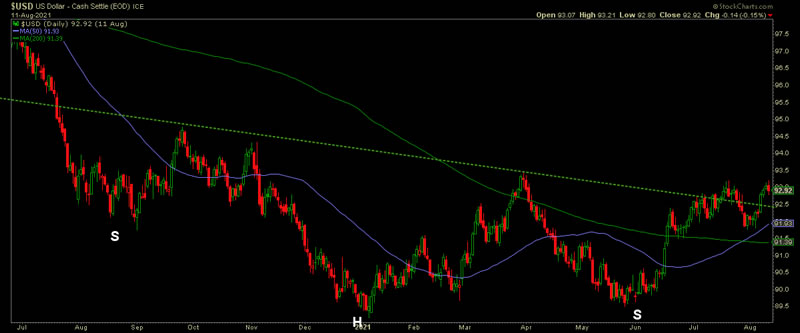
For its part, the global counter-party to the 2020-2021 inflation trades, the US dollar, is in bottom-making mode. This chart was used in NFTRH back in June to explore the possibility of an important low. Daily USD then broke above the inverted H&S neckline, failed, successfully tested the SMA 50 and now here it is again, with only the late March high standing in the way of significantly higher levels.
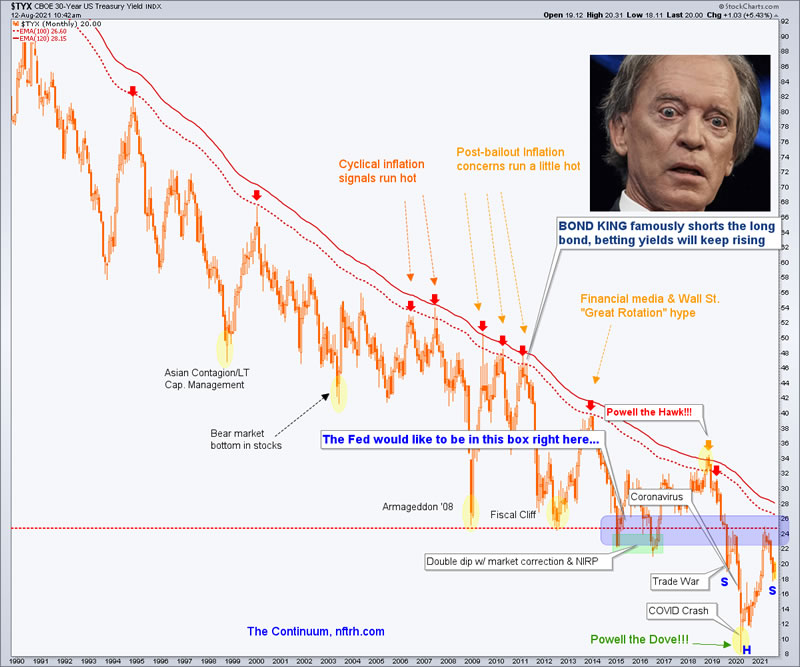
Finally, the chart that gives me pause if I am an active bear against the markets, including the inflation/reflation markets (like commodities, materials, banks, energy, etc.). The (monthly chart of the 30yr yield) Continuum tells us that theoretically at least, the Fed still has room to inflate before a red alert goes off and halts this desperate inflationary operation.
If not for the beautiful right side inverted shoulder that is near perfectly in line with our original thesis of summer cool down and then renewed inflation, I’d be getting whole hog bearish the markets followed by a readiness to greedily buy gold miners on the ensuing crash. That is what the market wants right now and as such, absent more of the Fed’s MMT (TMM, total market manipulation) that’s what I want to see, because it would be logical and natural. A post-boom bust. But the status of the Continuum, which as it currently stands is exactly as we’d planned for (an interruption but not termination of the inflation trades) tempers the liquidity crisis view.
Bottom Line
It is as I’ve been personally struggling with lately; the market following its current signals toward a liquidity problem and potential crisis per GSR and USD, or another kick save by the Fed and other central banks as licensed by the nowhere near extreme 30yr yield Continuum above.
In the here and now, the market has enough current liquidity to lurch onward without a big bearish event. But at some point it’s going to need more juice. The Gold/Silver ratio is an early indicator to that.
One thing seems inevitable; absent monetary intervention (i.e. more manipulation), this thing is going to pancake in the coming months. In the short-term we’ll continue to manage what we see and hope to gauge the odds one way or the other based on new information. The Fed also sees – and probably obsesses upon – liquidity indicators like these. What’s more, per the Continuum above it has license to try to combat them. #toughmarket
Subscribe to NFTRH Premium (monthly at USD $33.50 or a 14% discounted yearly at USD $345.00) for an in-depth weekly market report, interim market updates and NFTRH+ chart and trade setup ideas, all archived/posted at the site and delivered to your inbox.
You can also keep up to date with plenty of actionable public content at NFTRH.com by using the email form on the right sidebar and get even more by joining our free eLetter. Or follow via Twitter ;@BiiwiiNFTRH, StockTwits or RSS. Also check out the quality market writers at Biiwii.com.
By Gary Tanashian
© 2021 Copyright Gary Tanashian - All Rights Reserved
Disclaimer: The above is a matter of opinion provided for general information purposes only and is not intended as investment advice. Information and analysis above are derived from sources and utilising methods believed to be reliable, but we cannot accept responsibility for any losses you may incur as a result of this analysis. Individuals should consult with their personal financial advisors.
Gary Tanashian Archive |
© 2005-2022 http://www.MarketOracle.co.uk - The Market Oracle is a FREE Daily Financial Markets Analysis & Forecasting online publication.