Crude Oil Truth
Commodities / Crude Oil Oct 27, 2008 - 02:26 PM GMTBy: Mike_Paulenoff

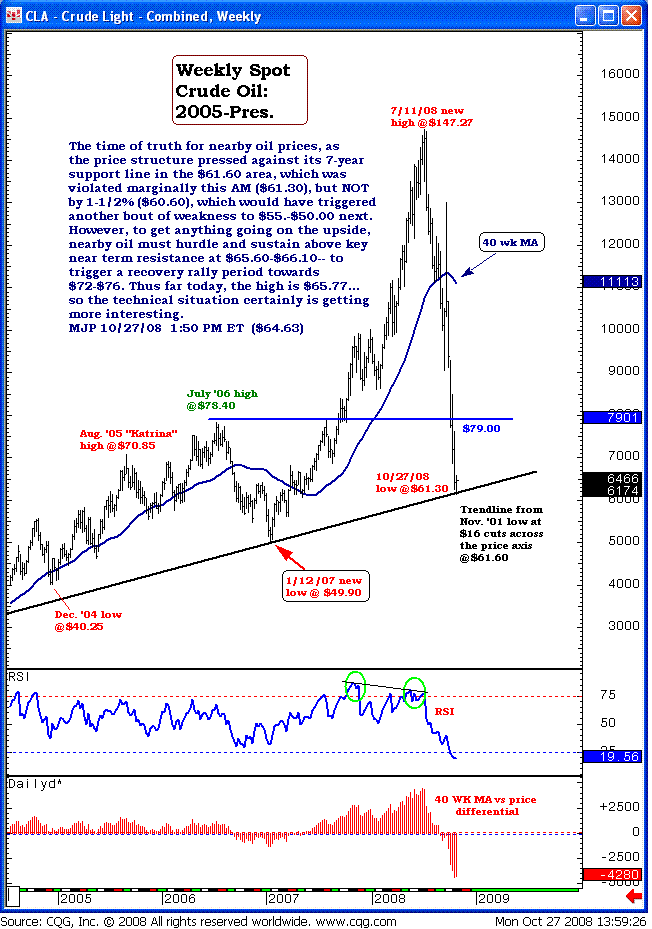
 I am not ready to step up to add the U.S. Oil Fund ETF (AMEX: USO) to our model portfolio just yet, but I am getting much friendlier to the idea technically. Looking at the weekly crude oil chart, it's the time of truth for nearby oil prices, as the price structure pressed against its 7-year support line in the $61.60 area, which was violated marginally this morning ($61.30), but NOT by 1-1/2% ($60.60), which would have triggered another bout of weakness to $55.00-50.00 next.
However, to get anything going on the upside, nearby oil must hurdle and sustain above key near-term resistance at $65.60-$66.10 to trigger a recovery rally towards $72-$76. Thus far today, the high is $65.77…so the technical situation certainly is getting more interesting.

Sign up for a free 15-day trial to Mike's ETF Trading Diary today.
By Mike Paulenoff
Mike Paulenoff is author of the MPTrader.com (www.mptrader.com) , a real-time diary of Mike Paulenoff's trading ideas and technical chart analysis of Exchange Traded Funds (ETFs) that track equity indices, metals, energy commodities, currencies, Treasuries, and other markets. It is for traders with a 3-30 day time horizon, who use the service for guidance on both specific trades as well as general market direction
© 2002-2008 MPTrader.com, an AdviceTrade publication. All rights reserved. Any publication, distribution, retransmission or reproduction of information or data contained on this Web site without written consent from MPTrader is prohibited. See our disclaimer.
Mike Paulenoff Archive |
© 2005-2022 http://www.MarketOracle.co.uk - The Market Oracle is a FREE Daily Financial Markets Analysis & Forecasting online publication.


