


Your Journey to High-Confidence Stock and Commodity Markets Trading Starts Now With Corrective Elliott Wave Patterns
InvestorEducation / Elliott Wave Theory Mar 20, 2022 - 05:32 PM GMTBy: EWI
 Soybeans and Apple stock (AAPL): Corrective patterns signaled opportunities in these disparate markets. Your market could be next!
The last 2 years have been a time of immense global adversity with the most challenging human health crisis in over a century.
But it has also been a time of immense personal growth. The uncomfortable realization of our dependence on others for everything from entertainment, education, nourishment, and income came into stark, swift focus. And with it, how quickly those things can be taken away without warning because of that dependence.
In turn, the pandemic saw an insatiable industry of online self-improvement crash courses emerge on home garden horticulture, podcast making, home building, home schooling, and -- learning to trade financial markets to "ensure a steady livelihood despite economic setbacks."
The problem is, learning to trade isn't like learning to plant tubers in your backyard. It's much more complicated and can't be fully conveyed with mock "trials" or simulated positions. At best, many of such courses get people in the door, but not seated at the table of real-world practice and risk-management.
That's where our respected partner Elliott Wave International (EWI) comes in. Its team of market analysts and technical analysis instructors has committed itself to leading the most comprehensive educational journey of the company's 42-year long history.
EWI's ultimate goal for 2022: Empower market newbies and veterans alike to develop and deepen their opportunity-spotting skills through the independent forecasting model known as Elliott wave analysis.
In brief, Elliott wave analysis, aka the Wave Principle, is founded on these core observations:
- Market trends are driven by trends in collective investor psychology
- Investor psychology progresses in 2 modes, impulsive and corrective
- Correctly identifying these patterns at their onset illuminates future price action
One such mode of market progress is the correction, which is best defined by the "bible" of all things Elliott, Elliott Wave Principle -- Key to Market Behavior:
"Markets move against the trend of one greater degree only with a seeming struggle. Resistance from the larger trend appears to prevent a correction from developing a full motive structure... Specific corrective patterns fall into three main categories: Zigzag, flat and triangle."
Characterized as often choppy, sloppy meandering lulls that move against the main trend, corrective patterns provide the ultimate gift; namely, TIME. Time for traders to establish a solid footing before the resumption of the larger trend.
So, we wanted to till the soil with real-world examples of how EWI's instructor Jeffrey Kennedy used corrective waves to alert traders to recent opportunities in two disparate markets.
-- The Surge in Soybeans --
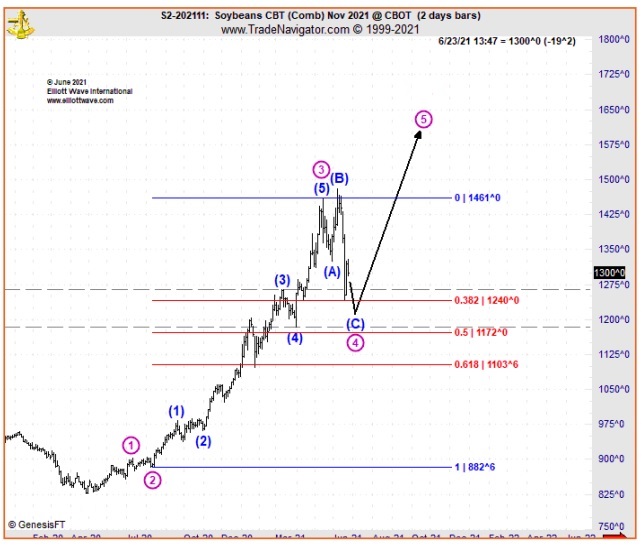
In the June 2021 Monthly Commodity Junctures "Wave Watch," Elliott Wave international's Chief Market Analyst Jeffrey Kenney showed the following chart of soybeans.
(Editor's Note: Monthly Commodity Junctures is EWI's service for spotting long-term opportunities in the world's leading grains, softs, livestock, food, metal and energy markets.)
Prices appeared to be falling in a fourth (corrective) wave off the June 2021 high. If correct, Jeffrey could use one simple guideline of corrective waves to determine not only where the decline might end, but also what type of move would follow.
Chapter 2 of The Elliott Wave Principle summarizes this guideline:
"No market approach other than the Wave Principle gives a satisfactory answer to the question, 'How far down can a bear market be expected to go?' The primary guideline is that corrections, especially when they themselves are fourth waves, tend to register their maximum retracement within the span of travel of the previous fourth wave of one lesser degree, most commonly near the level of its terminus."
Armed with this simple code of market behavior, Jeffrey was able to establish a confident forecast for beans. In the June Monthly Commodity Junctures, Jeffrey said:
"I like the idea of higher prices. I believe recent selling will prove to be a corrective move. I like this movement to the downside as an expanded flat fourth wave move. As we get into the next week, I will be looking for the culmination of this fourth move right in this area here between 1230-1210 and then, following that, another advance to the upside to give us a new high for the year."
This next chart shows how soybean prices followed Jeffrey's analysis to the letter: The fourth wave decline ended in Jeffrey's target area and reversed up in a powerful rally to new highs.
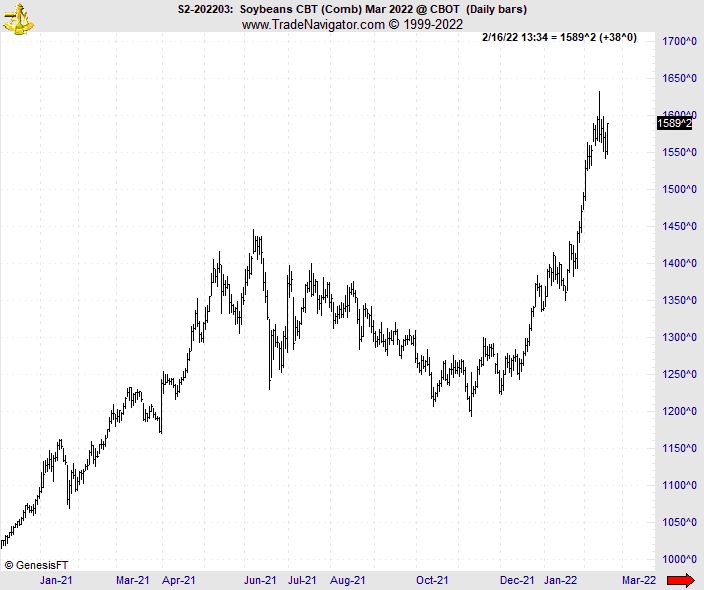
You can learn about the guideline that enabled Jeffrey to identify where the fourth wave in soybean would end in Chapter 2 of The Elliott Wave Principle -- Key to Market Behavior. The online book is available for free to Club EWI members >>
-- Apple Inc. Thrusts to New Highs --
In mid-2021, Apple stock was about as exciting as watching an apple ripen on its branch. Prices hadn't budged from a rangebound trend in the 10 months between September 2020 and June 2021. Said one May 4, 2021, Yahoo Finance:
"The tech wreck could continue as the reflationary environment will likely, drive up bets on cyclicals.
"Tech has had its day in the sun."
But on June 7, 2021, EWI's action-oriented Trader's Classroom, also edited by Jeffrey Kennedy, had something different to say about Apple's future; namely, the sun was about to start shining on this tech giant once again. There, Jeffrey showed this chart of the Nasdaq listee AAPL which labeled the months-long sideways price action as an Elliott wave triangle, the most patience-trying of all the corrective structures.
Here, Elliott Wave Principle -- Key to Market Behavior sheds light on the triangle pattern:
"A triangle appears to reflect a balance of forces, causing a sideways movement that is usually associated with decreasing volume and volatility. The triangle pattern contains five overlapping waves that subdivide 3-3-3-3-3 and are labeled A-B-C-D-E.
"A triangle always occurs in a position prior to the final actionary wave in the pattern of one larger degree... Elliott used the word "thrust" in referring to this swift, short motive wave following a triangle."
From the idealized diagram of a triangle, and now to the real-world triangle on Apple's price chart:
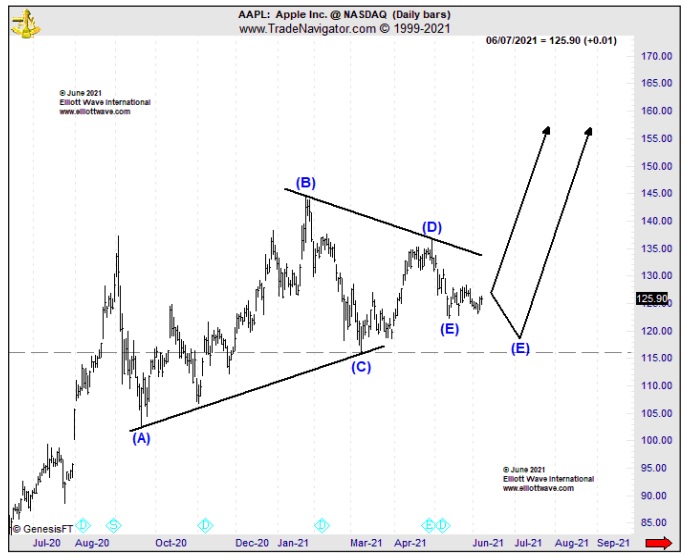
But, as Jeffrey's analysis of Apple made clear, those who wait triangles out are often generously rewarded. Here is an excerpt from Jeffrey's Trader's Classroom analysis of AAPL on June 7, 2021:
"We've basically gone sideways pretty much. We're trading 127 now. That's what we were doing a few months ago and that's what we were doing a few months prior to that, and a few months prior to that.
"My best wave count for Apple is that this is a contracting triangle fourth wave and we've still got one more wave coming, a pop higher in wave five for the post-triangle thrust."
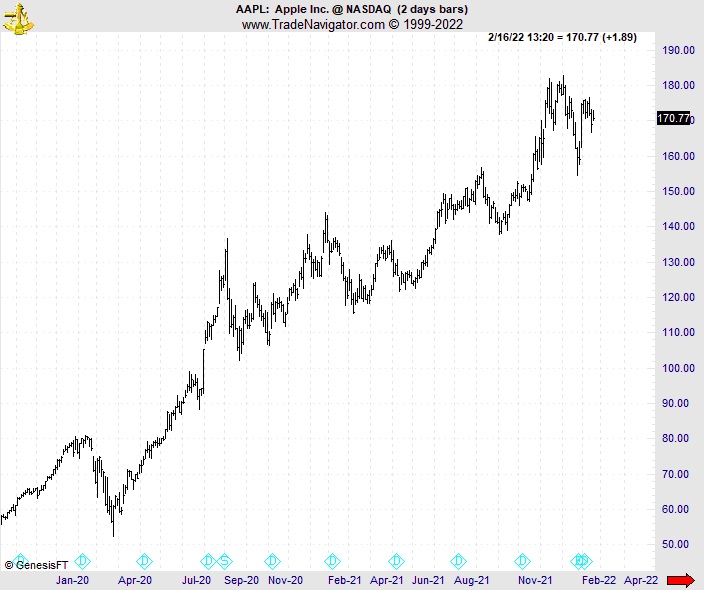
The chart below follows the stock's performance from there, where Apple soared 40% to reclaim record highs.
Seeing a triangle on a market's price chart gives you an invaluable advantage -- one that starts with knowing what the pattern is, how many types of triangles there are, and how to identify it in real time, all lessons covered in Elliott Wave Principle -- Key to Market Behavior. The book gives a refresher course on the core Elliott wave tenets, such as:
- Definitions and diagrams of the core Elliott wave patterns
- Three cardinal rules of Elliott wave analysis
- Summary of all Elliott wave guidelines
- Common Fibonacci retracements
- Behavior of specific waves and corresponding investor psychology
You can sign up on EWI's website to read the digital version for free.
This article was syndicated by Elliott Wave International and was originally published under the headline The Journey to High-Confidence Trading Starts Now! Next Stop: Corrective Elliott Wave Patterns. EWI is the world's largest market forecasting firm. Its staff of full-time analysts led by Chartered Market Technician Robert Prechter provides 24-hour-a-day market analysis to institutional and private investors around the world.
© 2005-2022 http://www.MarketOracle.co.uk - The Market Oracle is a FREE Daily Financial Markets Analysis & Forecasting online publication.