


Can the Stock Market Hold Lows Despite Spiking Yields and Dollar Panic Buying?
Stock-Markets / Stock Market 2022 Oct 30, 2022 - 11:03 PM GMTBy: Nadeem_Walayat

Dear Reader
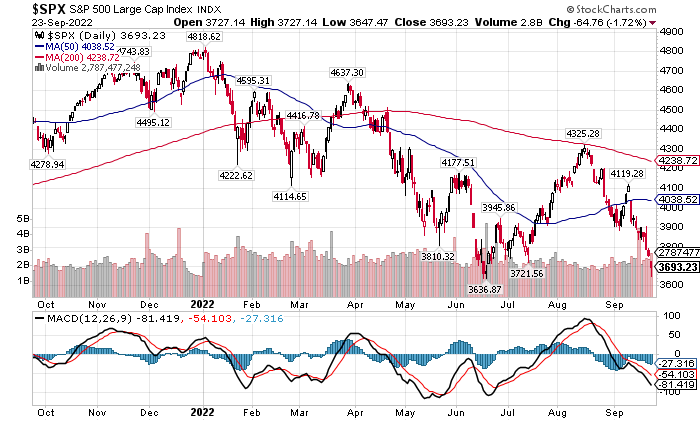
To break the June Low or not to break the June low, that is the question?
Or is it? Yes the S&P priced in sterling really did trade at an new all time high in August!
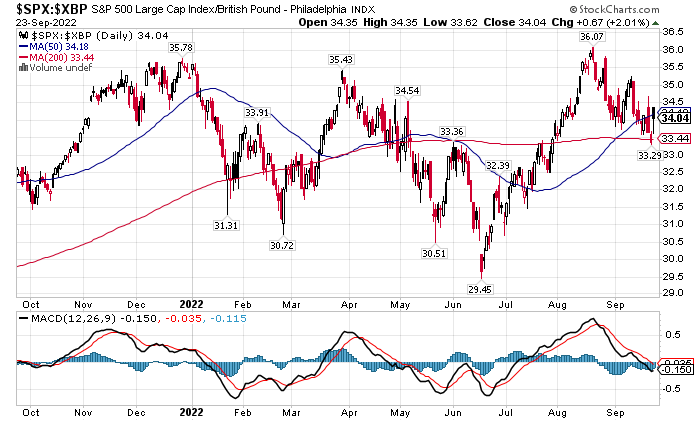
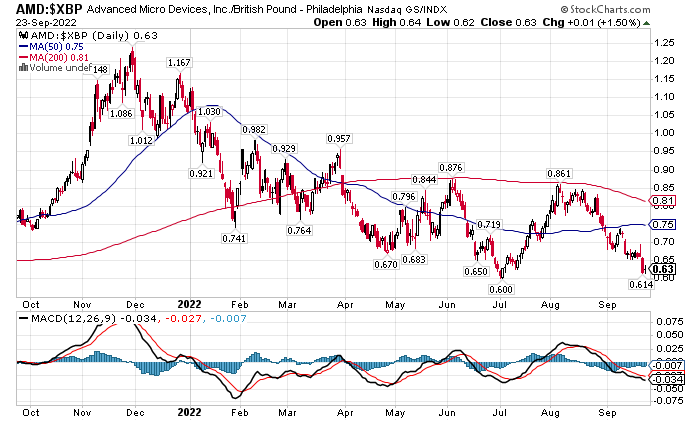
So the bear market pain flows both ways, pain for those seeing stocks fall to June lows and pain for those unable to participate in the sell off because US stocks are failing to drop in ones domestic currency presenting very few buying opportunities such as AMD that has come tantalising close to it's June low in GBP.
(Charts courtesy of stockcharts.com)
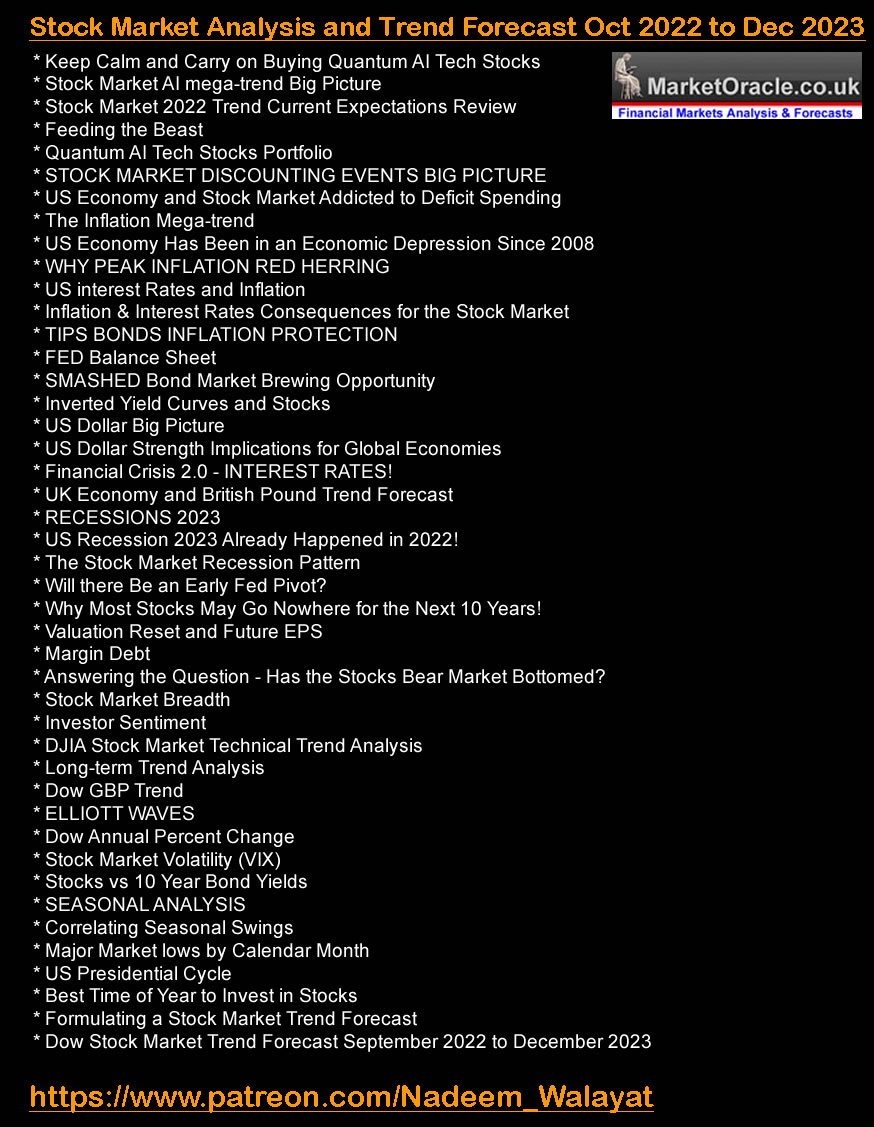
This article was was first made available to patrons who support my work - Can the Stock Market Hold June Lows Despite Spiking Yields and Dollar Panic Buying?. So for immediate first access to ALL of my analysis and trend forecasts then do consider becoming a Patron by supporting my work for just $4 per month.which is soon set to rise to $5 per month for new signups so lock it in now at $4 per month. https://www.patreon.com/Nadeem_WalayatIncluding access to my extensive analysis that concludes in detailed stock market trend forecast into the end of 2023 Stock Market Analysis and Trend Forecast Oct 2022 to Dec 2023
An excerpt of how the US Dollar could trend over the next couple of years.
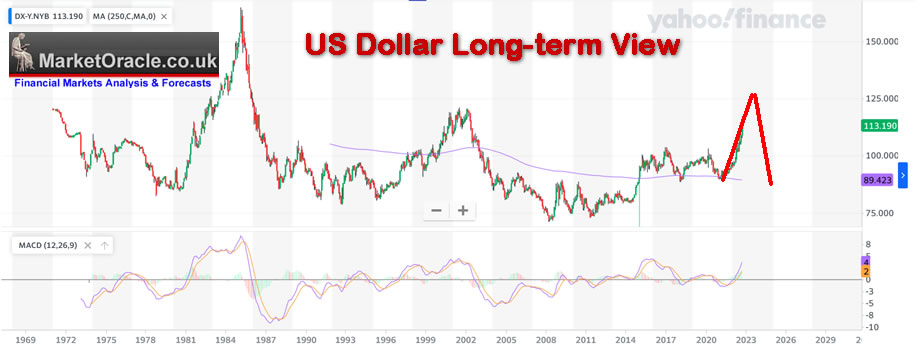
I also include a chart of what the GBP will do, and yes it will spike to BELOW parity to the dollar, that's a good 8% drop from the current rate of £/$ 1.08.
Stock Market Trend Expectations
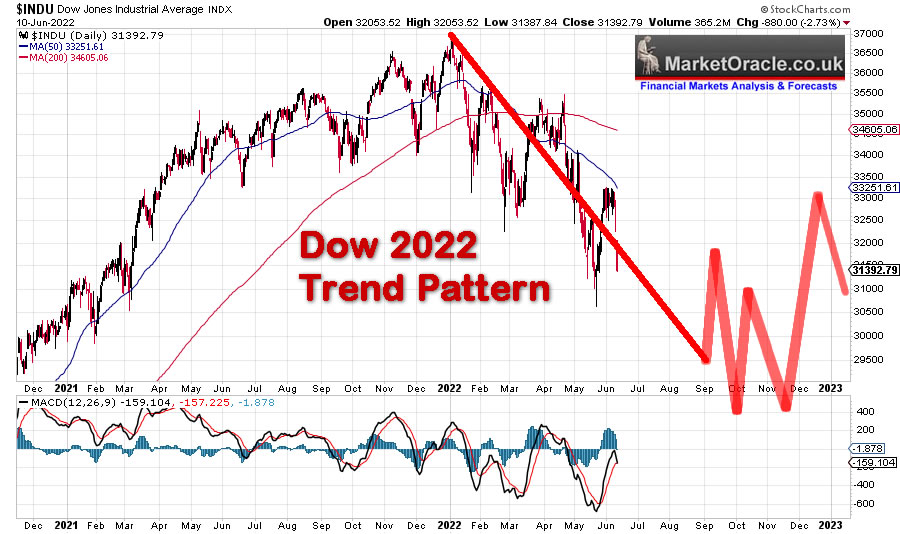
The existing sum of all of analysis as of June 2022 concludes in the following trend pattern into the end of the year which indicates we are due a corrective rally of sorts ahead of a lower low in October.
Since which I have posted two pieces of sub analysis from my imminent my mega analysis.
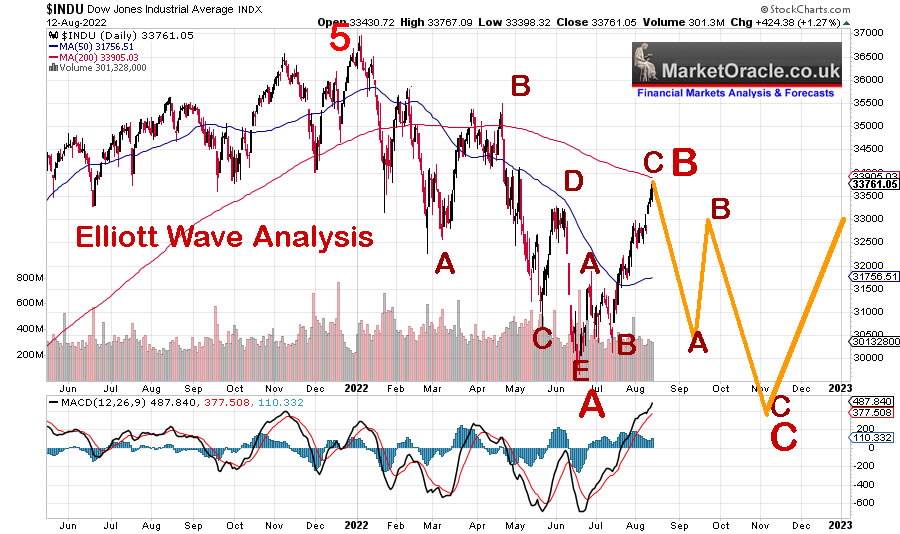
Elliot Waves that also suggest that stocks are due a trend higher before falling into the mid-term election and bounce higher afterwards.
Which was followed by my 50% rallies off the bottom study that suggests there is a 80% probability that the bear market bottomed in June at 3620, that we are currently less than 2% away from breaking!
However note the above 2 are component studies, they are not the most probable trend trajectories, yes each carries a weight but so do a multiple of others as indicated by the contents list above. This is why arriving at a trend forecast is mot easy and takes time. Most analysts do a study and that's it, they run with it like a dog with a bone! For instance do an elliott wave count and run with it! However as I often repeat, each method of analysis such as elliott waves on their own are literally a coin toss! It's not going to work, instead one needs to soak in the market like the electro magnetic spectrum across all wave lengths, that is how one arrives at high probability trend forecasts, they emerge from a soup of analysis that I call sub components, elliot waves are sub component, the 50% study is a sub component, to elevate a sub component to more than what it is is a big mistake as many are doing with the 50% study. Yes it would be great if this sub component was accurate but the probability of it being so on it's own is a coin flip! This is how things are.
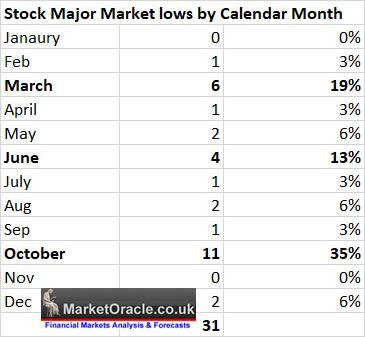
People keep asking me are the June lows the low, so I did a study to see if they could be that concluded in a 80% probability that yes June could be the low, which is pretty strong where markets are concerned but it does not negate the sum of my analysis that points to several spikes below the June low during October, for a component is just that a component of what will became the next sum of all of my analysis. that I am seeking to conclude in over the next few days, regardless of what happens the study doesn't change, it states a fact that there is an 80% chance that the June lows are the bear market low in the S&P, that is they lay of the land and why my final trend forecasts are necessary else all one has a cocktail of conflicting analysis.
Stock Market Current State of Play
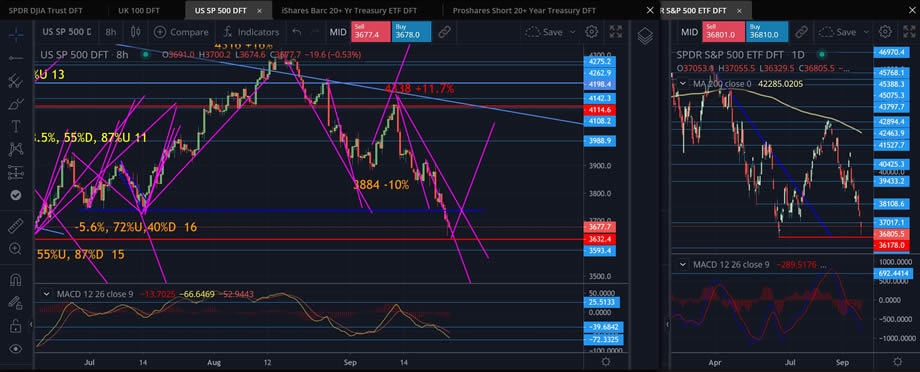
S&P closed at 3680. trading to a low of 3633, June's low is 3622, so the 50% retracement studies conclusion so far remains in tact which implies that this decline is a bear trap, to be clear a trap for the bears all betting on a collapse into the abyss of 3,200 and below, fantasy numbers such as 3000 area being bandied around, and apparently Monday 26th is the end of the SHIEMITA when a big CRASH is due!, Note I don't for a minute take this nonsense seriously, anyway today's the last day of the SHEIMTA that was ironically brought to my attention in June near the bear market lows when there were shrill cries of SELL EVERYTHING NOW! In which case the Shemita folk are looking to break even today (in US dollars). To be clear SHIMTA is BS, but like all BS's there will be coincidences which with the benefit of hindsight will be twisted and turned into support of BS as will probably happen to this SHEIMITA where what it originally implied will be subverted with the benefit of hindsight, that's the case with religious mumbo jumbo, people actually do want to believe in the super natural! That ancient religious texts somehow have magic powers to predict what the stock market will do in 2022 which can only happen via a self fulfilling prophecy, i.e. if enough believe in it and act on it then yes it sort of comes true, which in fact is the basis of Technical Analysis, traders and algo's lock step acting on wiggly lines on the charts. A quick google shows that most of the major market CRASH events happened AFTER SHEMITA but for some reason SHEMITA claims jurisdiction over them as well i.e. 1987 Crash, 9-11 attack and so on,
Anyone remember what happened in September 2015? Apparently we were days away from global economic destruction
![]()
https://cointelegraph.com/news/the-shemitah...
Enough on this!
This is the current state of play, so far 3620 still stands and given subsequent price action suggests that the market is ripe for a rally into the end of September/ early October. Looking at the put call ratio then the market is betting big on a big drop, usually at such extremes the opposite tends to happen.
At the time of this analysis the S&P early Monday morning is trading lower to 3678. In terms of swing projections it is possible that the June low could break, with swing projections targeting between 3500 and 3475. However recent swings have tended to to terminate earlier than projected by approx 1/3rd which implies that it remains probable that the June low manages to hold. to target a rally into the end of the month to 3930 to 4000.
What if the low breaks? We'll then we will be heading pretty swiftly down to 3500. The US economy IS contracting for which we only need to look at the yield curve that is showing an extreme inversion, with the 2 year yield spiking to well over 4%, in fact it's currently spiked to 4.22%! And with soaring yields so soars the USD, currently at $113, targeting a spike to $120.
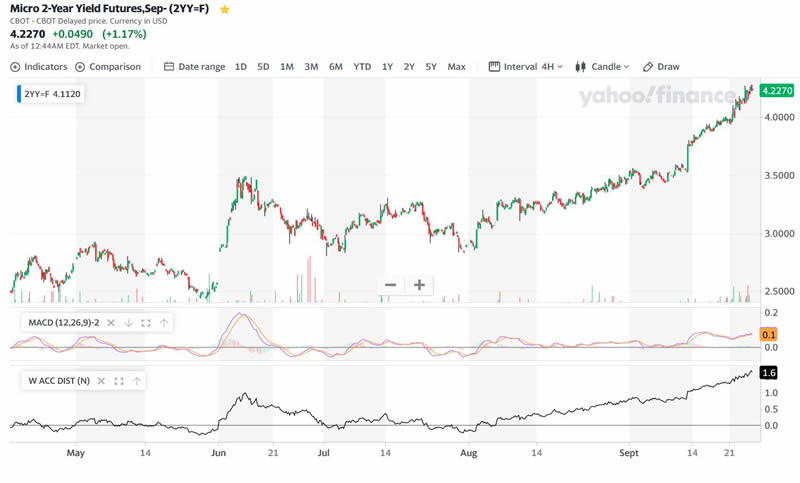
Under these circumstances one should not be asking if the June lows will break but why hasn't it already broken! A 2 year year yield at 4.2% and rising is extremely bearish for the indices i.e. there cannot be be a return to a a bull market anytime soon whilst yields are rising like this. Nevertheless current extreme bearishness does mean that stocks could be ripe for a spike higher and what better place to spike off then the June low, even if the market does look set to eventually break lower during October! Nor do rising yields and dollar bode well for the prospects for commodity prices such as the precious metals, Gold is NO safe haven!
AI Tech Stocks Portfolio
Buying the panic! My exposure now stands at 79% invested, 21% cash, where 100% equals total invested in AI tech stocks plus high risk stocks plus ALL cash on my investing accounts such as IKBR, AJ Bell, II, Free trade, Etorro. Furthermore since the start of the year I have added FRESH cash to accounts equivalent to 23% of the total value of my portfolio (including cash) at the start of the year that I will likely add more cash to during October. So if I had added no fresh cash I would now be 102% invested, vs approx 40% invested at the start of the year. Therefore during this bear market I have increased my exposure to the stock market by 155% compared to where I stood at the start of the year, baring in mind that I sold heavily going into the end of 2021, where at peak exposure I was probably at 90% invested.
The AI stocks buying levels has been updated where I am basically seeking prices at approx 10% to 15% lower for big buys in most target stocks, especially for those I have heavy exposure in i.e. my existing big buy for Google of $93 has now been nudged lower a little to $91.8.
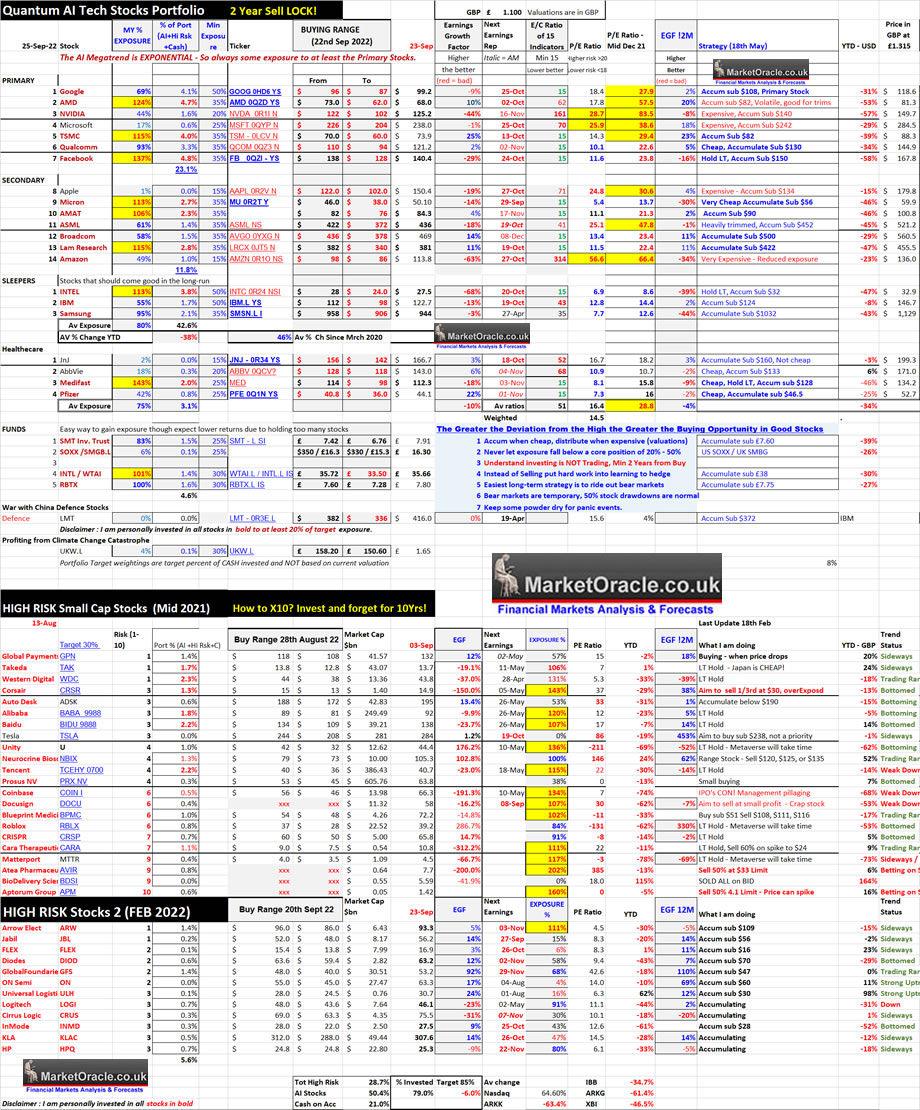
Table Big Image - https://www.marketoracle.co.uk/images/2022/Sep/AI-stocks-portfolio-26th-Sept-2022.jpg
Here are what I deem to be the best stocks trading at bargain basement prices (in relative terms) even for UK investors after sterling's collapse. Though do please refer to the updated buying levels in the wake of the current sell off as the fundamentals HAVE CHANGED i.e. 2 Year is 4.2% and rising, and the Dollar is at $113 and heading towards $120!
Top of the list is AMD $68, can you imagine $68! AMD is on the verge of becoming my largest single holding. AMD is in the calm before the buying storm stage when the market realises just how big Ryzen 7000 will be, soon followed by Radeon 7000 GPU's. Ryzen 7000 launch date is TOMMORROW! In the meantime AMD could spike down to as low as $60, I aim to buy more AMD despite being 124% invested..
Next would be WDC $34! Barely weeks ago I was trimming this at $62!
Then there's the four amigos Medifast, Intel, Lam Research and AMAT. Intel is a tough one, yes it's cheap but it's; because they keep churning out sub par hardware case in point being it's ARC GPU's that no one in their right mind will buy.
And last but not least NVIDIA $124 ! Though I seek lower prices for big buys $114, and $104 given that there is a flood of GPU's on the market following the Crypto collapse, so Nvidia earnings will be BAD! As the EGF's have been indicating for sometime.
Whilst on the cusps of being bargains are META and ASML, especially META as the market punishes stocks that invest for the long-run, as is Intel's experience, the market could mot careless about Intel's 15 new Fab's coming on stream during 2027, more than doubling it's output, or the Metaverse boom of 2024 following the release of Quest 3 in October 2023.
And for a stock that's not in my public portfolio, but part of my attempt to seek means of escaping a dying currency (sterling), COMCAST, EGF 15%, EGF12 7%, PE 9.3, Dividend 3.2%., down 50% from it's high. I bought some last week, will probably buy more next week. I also bought some Adobe though that is higher risk. The market is punishing stocks such as Adobe and META for investing in the future, that is something to take advantage of,
Remember these bargains are in relative terms at current price.
Putin Goes All In
Meanwhile Czar Putrid goes all in in Ukraine, annexation referendum and mobilization of 300,000 russian men who don't want to go to war.
No retreat, No surrender. Prepare for the use of tactical nukes, and it will be a lot more than 1 or 2 as I flagged to expect from the outset back in February, the only difference being that -
a. the Russian military sucks, most soldiers just want to rape and pillage whilst Ukrainians are fighting for their homeland.
b. US weaponry has been highly effective, especially LMT's HIMAR's.
Still there's not much Ukraine can do when faced with nukes.
And finally here is another snippet from my forthcoming mega analysis.
This article was was first made available to patrons who support my work - Can the Stock Market Hold June Lows Despite Spiking Yields and Dollar Panic Buying?. So for immediate first access to ALL of my analysis and trend forecasts then do consider becoming a Patron by supporting my work for just $4 per month.which is soon set to rise to $5 per month for new signups so lock it in now at $4 per month. https://www.patreon.com/Nadeem_Walayat
Also access to my extensive analysis that concludes in detailed stock market trend forecast into the end of 2023 Stock Market Analysis and Trend Forecast Oct 2022 to Dec 2023
Recent analysis includes -
- Intel Empire Strikes Back! The IMPOSSIBLE Stocks Bull Market Begins!
- Stock Market White Swan - Why Fed Could PAUSE Rate Hikes at Nov 2nd Meeting, Q4 Earnings
- Stocks Bear Market Max PAIN - Trend Forecast Analysis to Dec 2023 - Part1
- Stock Market Analysis and Trend Forecast Oct 2022 to Dec 2023
My Main Analysis Schedule:
- UK House Prices Trend Forecast - Complete
- Stock Market Trend Forecast to December 2023 - Complete
- US House Prices Trend Forecast - 80%
- Global Housing / Investing Markets - 50%
- US Dollar / British Pound Trend Forecasts - 0%
- High Risk Stocks Update - Health / Biotech Focus - 0%
- State of the Crypto Markets
- Gold and Silver Analysis - 0%
- How to Get Rich - 85%

Again for immediate first access to ALL of my analysis and trend forecasts then do consider becoming a Patron by supporting my work for just $4 per month.which is soon set to rise to $5 per month for new signups so lock it in now at $4 per month. https://www.patreon.com/Nadeem_Walayat
Your analyst.
By Nadeem Walayat
Copyright © 2005-2022 Marketoracle.co.uk (Market Oracle Ltd). All rights reserved.
Nadeem Walayat has over 30 years experience of trading derivatives, portfolio management and analysing the financial markets, including one of few who both anticipated and Beat the 1987 Crash. Nadeem's forward looking analysis focuses on UK inflation, economy, interest rates and housing market. He is the author of five ebook's in the The Inflation Mega-Trend and Stocks Stealth Bull Market series that can be downloaded for Free.


 Nadeem is the Editor of The Market Oracle, a FREE Daily Financial Markets Analysis & Forecasting online publication that presents in-depth analysis from over 1000 experienced analysts on a range of views of the probable direction of the financial markets, thus enabling our readers to arrive at an informed opinion on future market direction. http://www.marketoracle.co.uk
Disclaimer: The above is a matter of opinion provided for general information purposes only and is not intended as investment advice. Information and analysis above are derived from sources and utilising methods believed to be reliable, but we cannot accept responsibility for any trading losses you may incur as a result of this analysis. Individuals should consult with their personal financial advisors before engaging in any trading activities.
Nadeem Walayat Archive |
© 2005-2022 http://www.MarketOracle.co.uk - The Market Oracle is a FREE Daily Financial Markets Analysis & Forecasting online publication.