


WHY PEAK INFLATION IS a RED HERRING
Economics / Inflation Nov 18, 2022 - 10:12 PM GMTBy: Nadeem_Walayat

Dear Reader
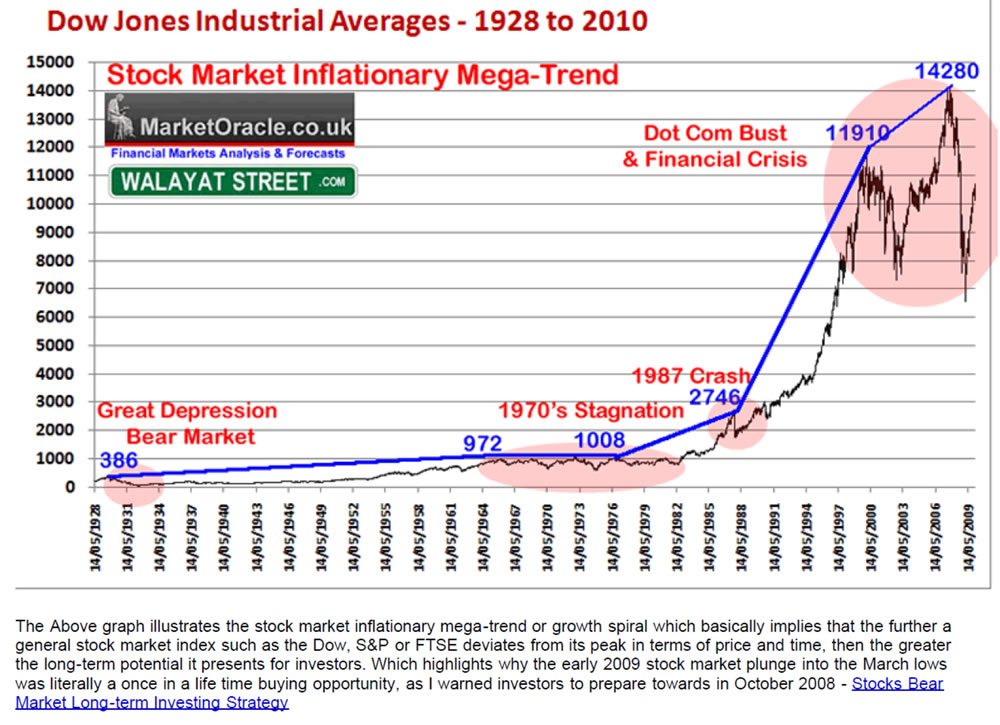
The Inflation Mega-trend
REAL INFLATON and not the BS statistics that the likes of the Fed and Bank of England vomit every month, fake inflation statistics watered down over decades to hide the stealth theft of wealth and purchasing power of wages and savings..
I have been calculating my my own inflation measure for the UK for a couple of decades now which computes to the UK inflation rate currently being at about 20% per annum! In fact it has been in a range of 15% to 20% for over a year!
As for the United States, shadow stats does a good job of calculating the real rate of inflation which ia based on the US governments own 1980 formulae that resolves to 13.5% vs 8.2%.
US Economy Has Been in an Economic Depression Since 2008
Wait things are even worse than that! You know the US GDP growth rate we are all bombarded with to illustrate the strength or weakness of the US economy, we'll it is just as FAKE as that which vomits out of the likes of the CCP.
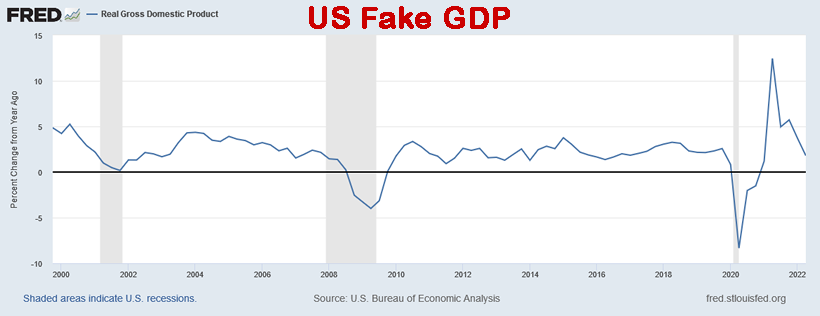
The Fed states US real GDP is currently +1.8% year on year. Now consider this, what inflation measure do you think the Fed is using to calculate these GDP figures? CPI? WRONG! GDP price deflator which tends to consistently under estimate inflation even against CPI as the following graph illustrates.
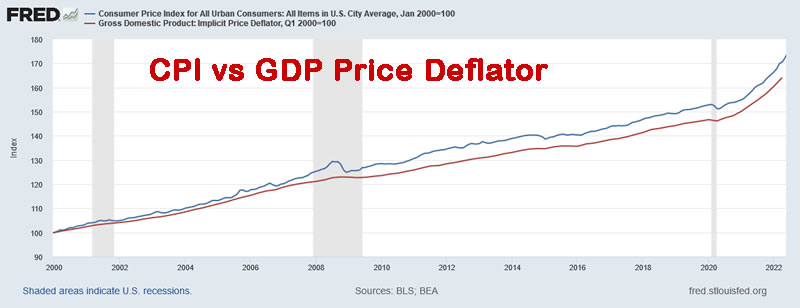
What's the difference? 172 divided by 164 which means that US GDP has been over reported by 4.8% since 2000.
What about against real shadow stats inflation? We'll if we used that measure than the US has been in an economic depression for the past 2 decades! What's most probable is that the truth lies somewhere between Shadow stats and CPI at around the half way mark of US inflation currently being around 11.5%. That would still suggest that overall the US economy has stagnated since the dot com bust with a growth rate that is about half that which has been reported and even worse performance since the Financial Crisis since when the probable real US growth rate has been ZERO!
So no wonder the Fed has been printing money on an ever escalating scale trying keep a dying economy ticking over, keeps kicking that day or reckoning can down the road for the next Fed President to deal with.
In terms of asset prices such as stocks and housing, the Fed cannot allow for any sustained drop in asset prices for it will literally bring the whole house of cards crashing down to reveal the true extent of the economic stagnation that the Fed has so far successfully masked by means of the inflation stealth tax. It's a case of printing money to infinity and beyond hence to remain invested in assets that are LEVERAGED to INFLATION and why this stocks bull market will just keep chugging long until the point when the Fed loses control of the QE monster that it has created. This is why I have been banging the Inflation Mega-trend drum for OVER A DECADE! QE4-EVER, QUANTITATIVE INFLATION, because there IS NO FREE LUNCH! You cannot bail out the banking crime syndicate without paying a price and that is loss of purchasing power by means of REAL INFLATION. as illustrated by my January 2010 Inflation Mega-trend ebook (free download)
And a 12 year long mantra of buying the deviation from the high -
I have been monitoring this Inflation train wreck for well over a decade, and warned we were definitely heading for very high inflation that HAS materialised.
And you know what's funny are the deflation fools out there that populate the mainstream press and blogosFear, regurgitating their deflation thesis despite it having been wrong for DECADES! As we have always been on the path towards to real HIGH inflation! You only get deflation right at the very end when everything collapses into a debt deflationary black hole! Which is why whilst most asset classes experience some pain from time to time as the Fed basically has fired most of it's bullets so is forced to adopt painful measures to correct the excesses then yes asset prices can fall (temporarily), but what is certain holding fiat currency is a going to be an even bigger loser than it has been for the past 10 years!
It's a case of trying to limit the damage done so that one can hold onto as much of ones wealth in real terms as possible.
This article is part 2 of 6 excerpts form my extensive analysis that concludes in detailed stock market trend forecast into the end of 2023 Stocks Bear Market Max PAIN - Trend Forecast Analysis to Dec 2023 was was first made available to patrons who support my work.So for immediate first access to ALL of my analysis and trend forecasts then do consider becoming a Patron by supporting my work for just $4 per month, which is soon set to rise to $5 per month for new signup's so lock in now at $4 per month. https://www.patreon.com/Nadeem_Walayat.
PART ONE: Stock Market Trend Forecast October 2022 to December 2023
Keep Calm and Carry on Buying Quantum AI Tech Stocks
Stock Market AI mega-trend Big Picture
Stock Market 2022 Trend Current Expectations Review
Feeding the Beast
Quantum AI Tech Stocks Portfolio
STOCK MARKET DISCOUNTING EVENTS BIG PICTURE
US Economy and Stock Market Addicted to Deficit Spending
The Inflation Mega-trend
US Economy Has Been in an Economic Depression Since 2008
WHY PEAK INFLATION RED HERRING
US interest Rates and Inflation
Inflation and Interest rates Implications for the Stock Market
TIPS BONDS INFLATION PROTECTION
FED Balance Sheet
SMASHED Bond Market Brewing Opportunity
Stocks and Inverted Yield Curve
US Dollar Big Picture
US Dollar Strength Implications for Global Economies
Financial Crisis 2.0 and Interest Rates
UK Economy and British Pound Trend Forecast
RECESSIONS 2023
The Stock Market Recession Pattern
PART TWO: Stock Market Trend Forecast October 2022 to December 2023
Will there be an Early Fed Pivot?
Why Most Stocks May Go Nowhere for the Next 10 Years!
Valuation Reset and Future EPS
Margin Debt
Answering the Question - Has the Stocks Bear Market Bottomed?
Stock Market Breadth
Stock Market Investor Sentiment
Dow Short-term Trend Analysis
Dow Long-term Trend Analysis
ELLIOTT WAVES
Dow Annual Percent Change
Stock Market Volatility (VIX)
Stocks and 10 Year Bond Yields
SEASONAL ANALYSIS
Correlating Seasonal Swings
Major Market lows by Calendar Month
US Presidential Cycle
Best Time of Year to Invest in Stocks
Formulating a Stock Market Trend Forecast
Dow Stock Market Trend Forecast September 2022 to December 2023
WHY PEAK INFLATION IS a RED HERRING
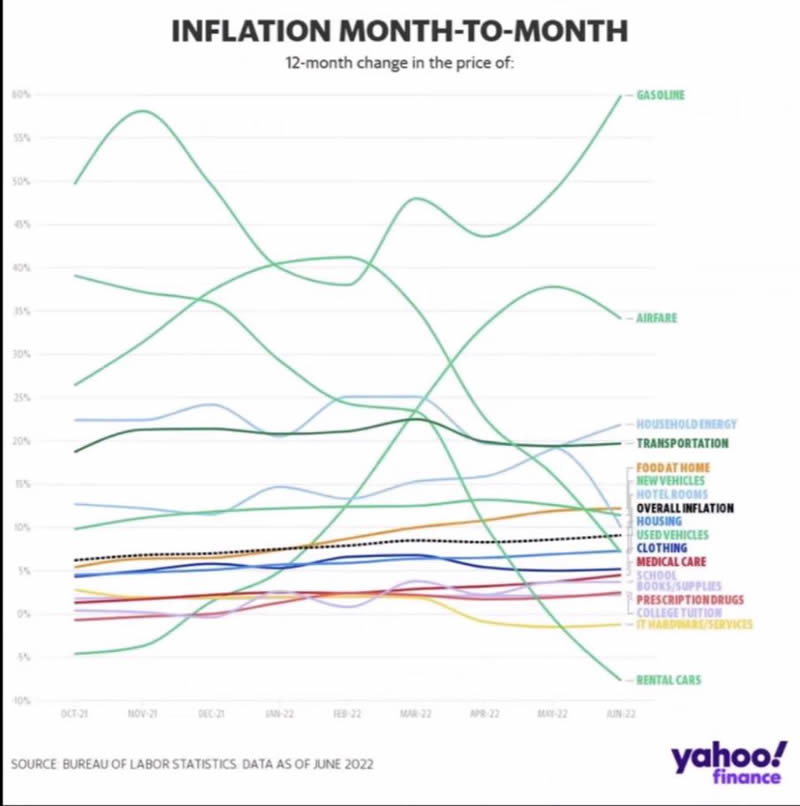
When one looks under CPI inflation hood then one sees strong signs of inflation topping, given what we have already seen transpire in the commodities markets such as Gasoline prices having fallen since the May inflation report and many of the components such as Airfares also turning lower.
So obviously this is being taken as good news, inflation has peaked so the Fed can take the foot off the brake, and I am sure will soon be accompanied by murmurs for the possible early return of QE. After all I can imagine many are thinking yes inflation is running hot at over 8% but it's not that bad, so maybe the 1970's were not as bad as people tend to make out to be?
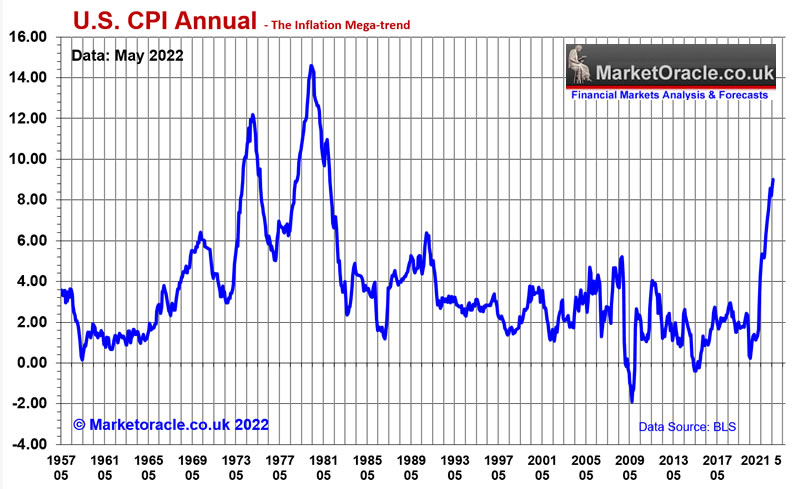
Unfortunately the annual change in the rate of inflation that virtually all focus on is a red herring and fails to represent the true damage done by inflation during the 1970's that the US and most of the rest of the West looks set to replicate during the 2020's for the fundamental fact that the PEAK Inflation that everyone is seeking and likely to get as early as next month is irrelevant! It's what happens in the run up to the peaks and in their aftermath that does all of the damage.This is why virtually ALL of the pundits and so called economists fail to understand that the PEAK INFLATION they are all focusing on is not the END of Inflation but marks the BEGINNING of the inflation PAIN that will persist for the whole of this decade.
So understand this all the pain folks have experienced to date is NOTHING compared to that which is to come where my following chart of the 10 YEAR inflation rate gives a clearer picture of what happened during the 1970's and what has a high probability of repeating during the 2020's.
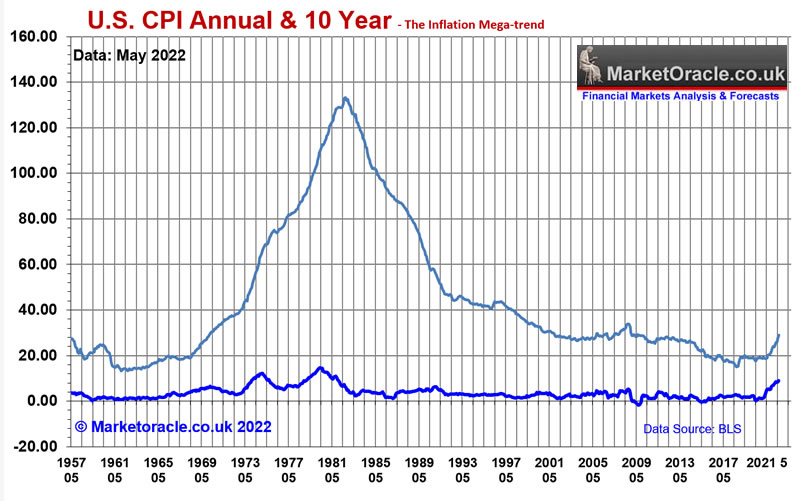
Those 12 month PEAKs are largely irrelevant! The US, UK and the rest are going to experience WAVES of inflation which whilst they won't exactly replicate the 1970's in terms of magnitude i.e. US inflation is peaking at 9% rather than say 12%, or 14%, but the issue is that everyone assumes that Inflation peaking is the end of the inflation story. NO, far from it, because as you rightly assume the Fed will take falling inflation as a cue to take the foot off the brake and thus the economy in the not too distant future will head towards it's NEXT INFLATION PEAK, and then the central banks will rinse and repeat for the peak following that which WILL result in a very similar 10 Year inflation graph as that which occurred during the 1970's and that is what will deliver the DECADE LONG INFLATION PAIIN that few are prepared for!
Most will fail to understand that a 50% drop in the rate of the inflation from 9% to 4.5% is NOT GOING TO DO ANYTHING in terms of the addressing the relentlessly worsening Inflation PAIN that most are destined to suffer for the whole of this decade! WE ARE ONLY AT THE BEGINNING OF THIE INFLATION PAIN as the the above chart illustrates, barely begun the assent that is going to wipe out the purchasing power of earnings and savings.
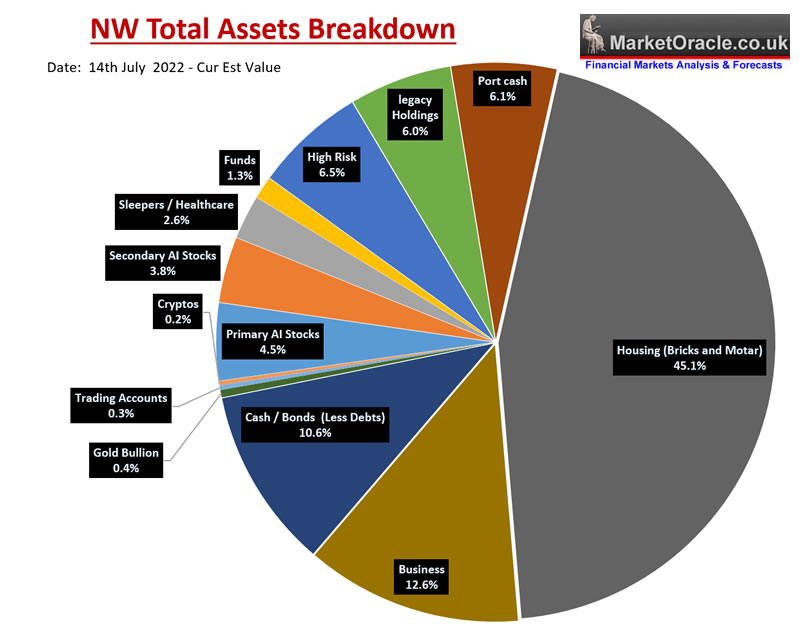
As for asset prices, to repeat one of my mantras, seek to be invested in assets that are leveraged to the inflation mega-trend that's Good stocks bought at fair valuations that can raise their prices, so basically one wants ones core portfolio to carry a LOW PE RATIO coupled with the potential for earnings growth, where my core AI stocks portfolio as measured by actual exposure carries a P/E of 14.2 that I expect earnings growth to continue to drive lower over the coming quarters. And then there is HOUSING that cannot be PRINTED! Which is where the bulk of my wealth resides (45%), with stocks targeting 30%,Which will still leave me with more than 25% in cash (as of July) that I aim to further whittle down to under 15% by probably plowing even more into stocks or property, probably very low volatility dividend stocks such as GSK.
So feel free to comment below your suggestions for other asset classes apart form precious metals to investigate to avoid the inflation stealth theft as my last resort will be to seek to buy another property, but as you are probably already aware property is NOT CHEAP! And unfortunately I don't see what is going to deliver lower prices given INFLATION, and NO the Ukraine war has little to do with oil price inflation, the real reason for high oil prices is the heart attack of negative oil prices of March 2020 when everyone cut back on investment which sowed the seeds for what we have today which the Ukraine war has contributed towards, but the war is NOT the primary reason for high oil prices, and now all the talk is of investing in boosting supply of oil and gas which inevitably sows the seeds for the next energy bust some years down the road, though against that we have the green lobby preventing investment.
The bottom line is that peak inflation that the pundits are focusing on is a red herring, unless there is a miracle where by magic CP LIE falls to 2%, but then again 2% CPLIE is really 3.5% so perhaps we need to see CPLIE averaging 1.5% for the Inflation monster and it's consequences to be fully contained. Unfortunately perched here at 8.2%, I don't see sub 4% let alone sub 2% anytime soon. So don't be fooled by the talking heads when they sing the praises of CPI falling to 5% in a few months time, for it will actually have changed NOTHING! Go look at the 1970's where the first trough was at 3% and the second was at 5%, they did NOTHING to avoid the relentless climb to the Inflation mountain top! NOTHING! There is still time to act to protect our wealth.
US interest Rates and Inflation
US market interest rates LEAD the inflation rate. even more so than that which the below graph implies as there is a couple of weeks delay in release of inflation data. And then there is the smoke and mirrors inflation game that the Fed plays i.e. core inflation vs CPI, core is CPI less food and energy because obviously people can survive without food and energy so are excluded so that the Fed gets a more manageable inflation number so as to make their job easier than if they had to cope with a truer inflation rate.
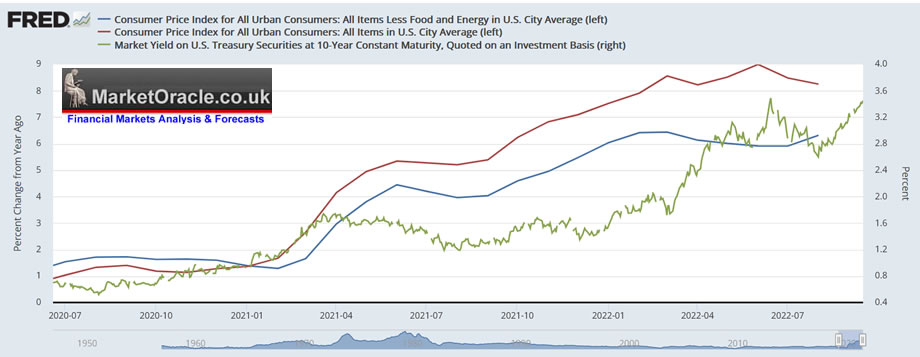
Interest rates imply to expect inflation to continue to remain elevated, i.e. a collapse in inflation is unlikely and that rising rates suggest inflation is going higher rather than lower at least for October's release which suggests downwards pressure on stock prices, even despite stock indices trading near bear market lows, therefore there remains a a good chance of new low during October.
Inflation and Interest rates Implications for the Stock Market
So inflation is not going significantly lower anytime soon, interest rates are still trending higher which does not bode well for the outlook for stocks. And then on top of that we have a weakening economy, STAGFLATION! Definitely not a time for investors to contemplate gambling on no earnings, even high multiples growth stocks. For the indices, it means downwards price pressure and then followed by a trading range..
Here's another indicator to pile on top of a mountain of indicators that I have been covering over the past few years that has been flashing a RED warning. The S&P real terms dividend yield is now far below anything we have experienced since the early 1980s' inflationary depression.
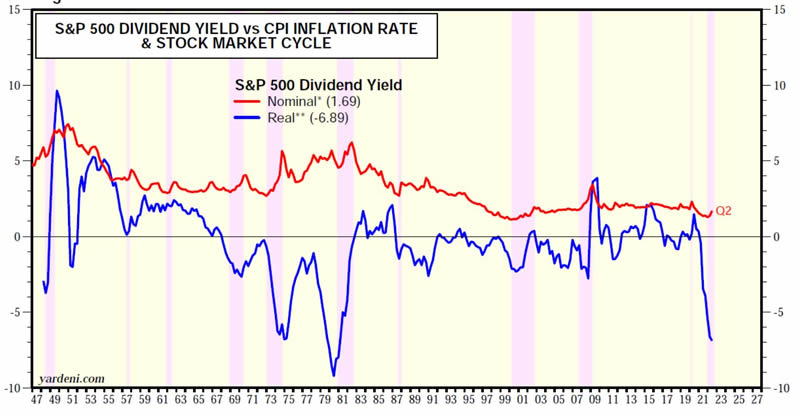
Real terms dividend rates are another harbinger for lower stock prices or at least sustained stagnation. So whilst stocks do tend to be leveraged to inflation, however that is only if earnings and dividends are able to keep pace with inflation and as we have seen inflation is surging higher whilst dividend yields are not. This is a chart to keep a close eye on for early signs for a the birth of a new stocks bull market, in the meantime the message at best is for a trading range.
TIPS BONDS INFLATION PROTECTION
How to protect one self form INFLATION! Well what the investment industry sold to their clients were Inflation Protected Bond funds! The sales pitch went that when Inflation soars and regular bonds fall don't worry you are protected so given that inflation has taken off like a rocket have these bond funds delivered on their sales pitch?
ishares TIPS Bond ETF
If you go to the ishares website you get this current chart which does not quite tell the true picture.in terms of the magnitude of the recent price drop and failure of TIPS to do what's written on the tin, i.e. protect against inflation.
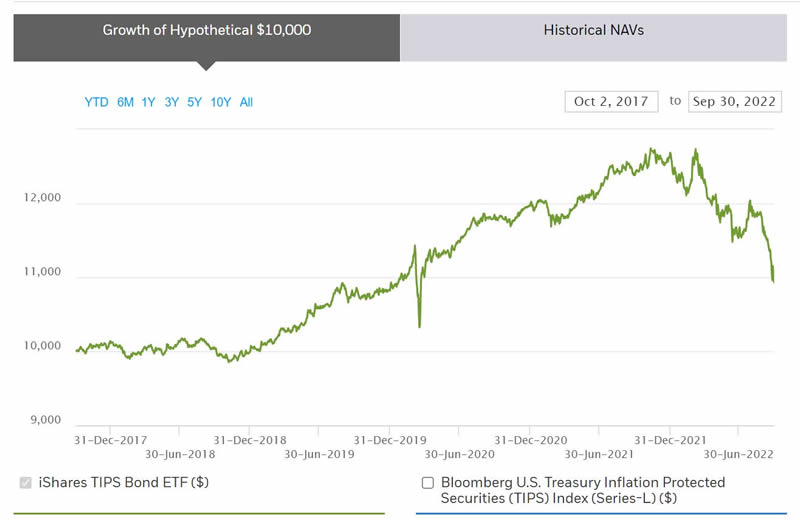
THIS is the reality of the so called TIPS! A spectacular collapse in price all the way back to levels not seen since 2011! This is why investors need to be wary of the sales pitches that vomit out of fund managers mouths who are nothing more than sales people eager to bank their annual fees by selling investors lemons such as this! Inflation protection they said! Instead investors get a collapse worse than if they had just invested in dividend paying stocks and without the upside of stocks!
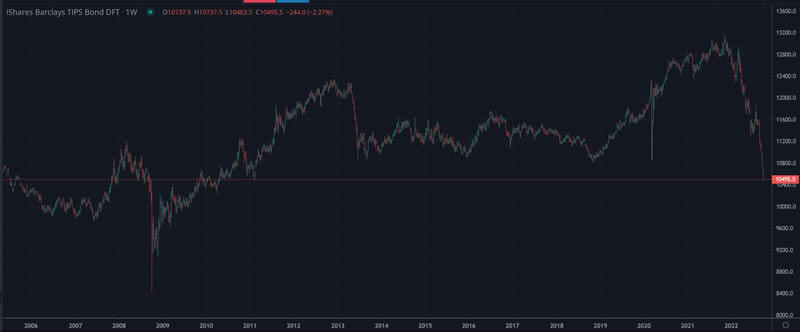
The bottom line is that if you wanted to invest in TIPS then steer clear of the funds, invest directly in the actual bonds that have maturity dates, where the longer the date the more volatile the bond price.
FED Balance Sheet
Not to forget the inflation mega-trend courtesy of rampant central bank money printing to monetize government debt coupled with the fake inflation indices where up until recently the Fed had succeeded in hoodwinking the masses that US inflation was just 1%. Instead at that time I warned it was more like 6%! Now it's more like 14%. Anyway the money printing binge now totals $8.8 trillion, up from $4 trillion at the start of 2020 and down from a a peak of $9.62 trillion in the so called Taper. We saw how the taper of 2019 went which at the time I warned would eventually resolve in the Fed Balance sheet DOUBLING. of course I was not expecting it to happen the very NEXT YEAR in 2020!
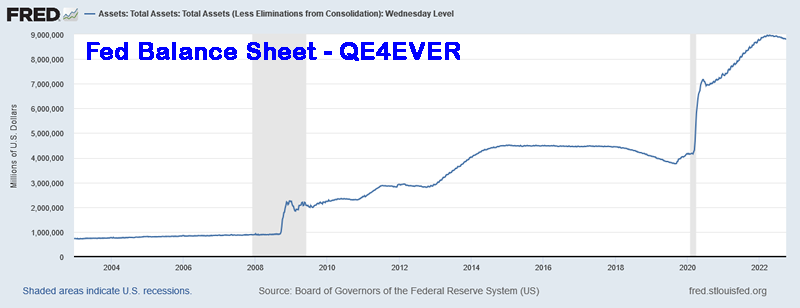
The bottom line is tapering is a temporary smoke and mirrors exercise that ultimately will resolve in a DOUBLING of the Fed balance sheet, that's right in the not too distant future I will be posting a chart of the Fed Balance sheet north of $16 trillion! CRACKUP BOOM HERE WE COME!
SMASHED Bond Market Brewing Opportunity
The consensus script is that when stocks fall bonds go up, instead 2022 saw that consensus view blown apart as the below chart illustrates. In fact bonds have NEVER under performed stocks during a downturn, not even during the raging inflation of the 1970's!
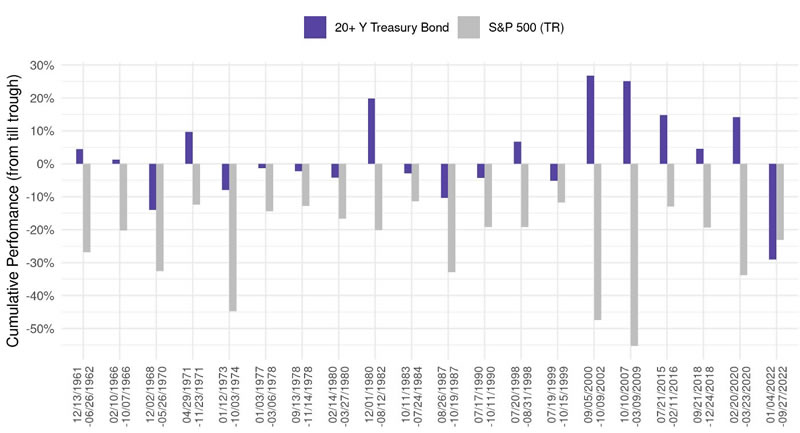
US bonds are down 50% form their all time, 15% year to date! Of course now with the benefit of hindsight all are pointing the finger at INFLATION which apparently turned out NOT to be transitory, much as I was warning a year ago when bonds were trading 50% higher in price (Protect Your Wealth From PERMANENT Transitory Inflation ).
I have never been much of an investor in bonds i.e. the only bond I hold is the UK 2030 4 1/4 index linked gilt, but I am definitely perking up to the prospects of deploying at least some of my cash into the decimated US and UK bond markets at some point. In terms of target exposure I doubt it will exceed 5% from the current 1% of portfolio, I am just not that much of a bond investor, not enough upside but do recognise there is an opportunity brewing in the not too distant future when bonds trade to new bear market lows.
Stocks and Inverted Yield Curve
The yield curve has inverted which initially saw the stock market trade to a new bear market low following which entered into a powerful bull run, as has happened virtually every time that the yield curve has inverted i.e. initial stock market dips followed by a bull run that typically extends to over a year which the current price action looks set to replicate despite the recent double dip.
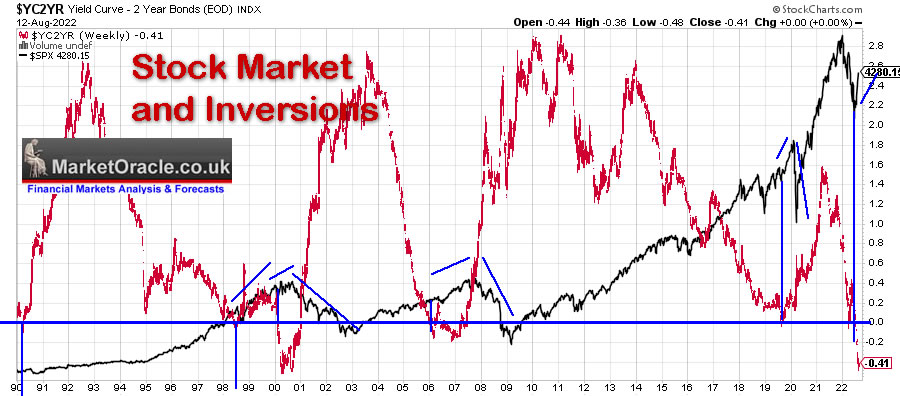
The yield curve inversion which has accurately called every modern recession signals that a recession is on the horizon within the next 9 to 18 months and that is the trigger for the bull run as the market will assume that the Fed will act looser before the US economy enters recession about 9 months from now, and thus the stock market discounts higher earnings over subsequent quarters in response to an expected looser Fed which remains the trend until the recession actually does start to bite and earnings fall.
What this suggests that stocks should enter a sustained bull run into Mid 2023, however it will be followed by subsequent weakness that depends on the actual severity of the forthcoming recession which is further complicated by the fact that we are already IN a technical recession!
So the yield curve implies stocks should head higher into Mid 2023 and then largely stagnate during the recession.
This article is part 2 of 6 excerpts form my extensive analysis that concludes in detailed stock market trend forecast into the end of 2023 Stocks Bear Market Max PAIN - Trend Forecast Analysis to Dec 2023 was was first made available to patrons who support my work.So for immediate first access to ALL of my analysis and trend forecasts then do consider becoming a Patron by supporting my work for just $4 per month, which is soon set to rise to $5 per month for new signup's so lock in now at $4 per month. https://www.patreon.com/Nadeem_Walayat.
Recent analysis includes -
- How High Could the Impossible Stocks Bull Market Fly Into Christmas 2022
- Stock Market Cool as a Cucumber Despite Earnings and Fed Noise
- Intel Empire Strikes Back! The IMPOSSIBLE Stocks Bull Market Begins!
- Stock Market White Swan - Why Fed Could PAUSE Rate Hikes at Nov 2nd Meeting, Q4 Earnings
- Stocks Bear Market Max PAIN - Trend Forecast Analysis to Dec 2023 - Part1
- Stock Market Analysis and Trend Forecast Oct 2022 to Dec 2023
My Main Analysis Schedule:
- UK House Prices Trend Forecast - Complete
- Stock Market Trend Forecast to December 2023 - Complete
- US House Prices Trend Forecast - 80%
- Global Housing / Investing Markets - 50%
- US Dollar / British Pound Trend Forecasts - 0%
- High Risk Stocks Update - Health / Biotech Focus - 0%
- State of the Crypto Markets
- Gold and Silver Analysis - 0%
- How to Get Rich - 85%

Again for immediate first access to ALL of my analysis and trend forecasts then do consider becoming a Patron by supporting my work for just $4 per month, which is soon set to rise to $5 per month for new signup's so lock in now at $4 per month. https://www.patreon.com/Nadeem_Walayat.
And ensure you are subscribed to my ALWAYS FREE newsletter for my next in-depth analysis.
Your stealth bull market investing analyst.
By Nadeem Walayat
Copyright © 2005-2022 Marketoracle.co.uk (Market Oracle Ltd). All rights reserved.
Nadeem Walayat has over 30 years experience of trading derivatives, portfolio management and analysing the financial markets, including one of few who both anticipated and Beat the 1987 Crash. Nadeem's forward looking analysis focuses on UK inflation, economy, interest rates and housing market. He is the author of five ebook's in the The Inflation Mega-Trend and Stocks Stealth Bull Market series that can be downloaded for Free.


 Nadeem is the Editor of The Market Oracle, a FREE Daily Financial Markets Analysis & Forecasting online publication that presents in-depth analysis from over 1000 experienced analysts on a range of views of the probable direction of the financial markets, thus enabling our readers to arrive at an informed opinion on future market direction. http://www.marketoracle.co.uk
Disclaimer: The above is a matter of opinion provided for general information purposes only and is not intended as investment advice. Information and analysis above are derived from sources and utilising methods believed to be reliable, but we cannot accept responsibility for any trading losses you may incur as a result of this analysis. Individuals should consult with their personal financial advisors before engaging in any trading activities.
Nadeem Walayat Archive |
© 2005-2022 http://www.MarketOracle.co.uk - The Market Oracle is a FREE Daily Financial Markets Analysis & Forecasting online publication.