


U.S. Money Supply Deflates 2% Annually (What That Means)
Economics / Deflation Mar 24, 2023 - 10:02 AM GMTBy: EWI

The debt bomb implodes: Expect recession and deflation;
Many pundits have expressed worry about the ramifications of global debt -- and rightly so. As the Wall Street Journal noted toward the end of 2022:
The world has amassed $290 trillion of debt and it's getting more expensive to pay for it.
In the U.S. alone, the cost of servicing the national debt is expected to skyrocket over the next decade (Fox News, Feb. 27):
Interest payments on the national debt to reach $1.4 trillion annually in 2033: CBO
There's also the issue of household debt in the U.S. That debt bomb is already in the process of imploding. Here's a chart and commentary from our March Global Market Perspective, a monthly Elliott Wave International publication which covers 50-plus financial markets:
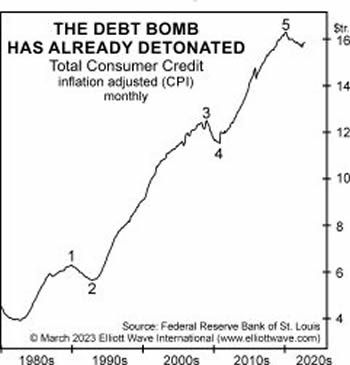
A rare shift in the mindset of consumers started in March 2020, when Real Total Consumer Credit began to decline. Since August 1982 … the growth in U.S. consumer debt has been almost straight up. But there were two prior episodes in which American consumers' otherwise insatiable appetite for debt dissipated: from December 1989 to October 1992 and from December 2008 to November 2011. Both periods encompassed economic recessions. It happened again starting in March 2020, but this time, real consumer debt failed to recover to new highs with the economy.
Another important point to make is that the balance sheets of the European Central Bank, the Bank of England and the Federal Reserve have been deflating -- and so has another key measure.
This chart and commentary are also from our March Global Market Perspective:
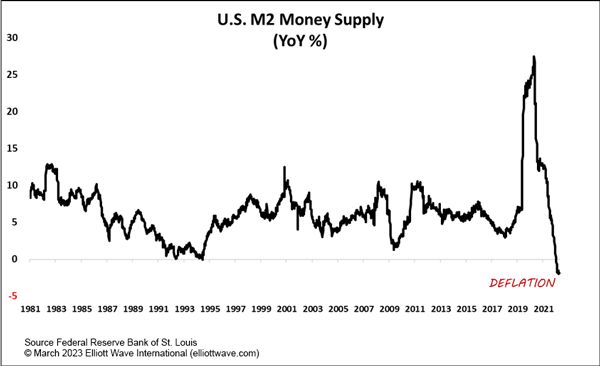
More deflation evidence comes in the form of overall money supply in the U.S. ... The chart shows the annualized percentage change in M2 since 1981. Apart from a very brief (one week!) foray into negative territory in 1995, money supply in the U.S. has been inflating for at least 40 years. Now, though, money supply is deflating at a current annualized clip of over 2%. This historic and now twelve-week-long contraction in money on this basis looks like it is becoming embedded.
It’s also a good idea to keep an eye on major worldwide stock indexes. History shows that global economies tend to follow global stock indexes. In other words, when stock markets tank, economies generally follow and vice versa.
You can get a handle on the main trends of global stock indexes by using the Elliott wave method.
If you’re unfamiliar with Elliott wave analysis, read Frost & Prechter’s Wall Street classic, Elliott Wave Principle: Key to Market Behavior. Here’s a quote from the book:
In markets, progress ultimately takes the form of five waves of a specific structure. Three of these waves, which are labeled 1, 3 and 5, actually effect the directional movement. They are separated by two countertrend interruptions, which are labeled 2 and 4. The two interruptions are apparently a requisite for overall directional movement to occur.
[R.N.] Elliott noted three consistent aspects of the five-wave form. They are: Wave 2 never moves beyond the start of wave 1; wave 3 is never the shortest wave; wave 4 never enters the price territory of wave 1.
[Elliott] did not specifically say that there is only one overriding form, the “five-wave” pattern, but that is undeniably the case. At any time, the market may be identified as being somewhere in the basic five-wave pattern at the largest degree of trend. Because the five-wave pattern is the overriding form of market progress, all other patterns are subsumed by it.
If you’d like to read the entire online version of the book for free, you may do so by joining Club EWI, the world’s largest Elliott wave educational community.
A Club EWI membership is also free and members enjoy free access to a wealth of Elliott wave resources on investing and trading.
Join Club EWI now by following this link: Elliott Wave Principle: Key to Market Behavior -- get free and instant access.
This article was syndicated by Elliott Wave International and was originally published under the headline U.S. Money Supply Deflates 2% Annually (What That Means). EWI is the world's largest market forecasting firm. Its staff of full-time analysts led by Chartered Market Technician Robert Prechter provides 24-hour-a-day market analysis to institutional and private investors around the world.
© 2005-2022 http://www.MarketOracle.co.uk - The Market Oracle is a FREE Daily Financial Markets Analysis & Forecasting online publication.