Could the Debt Ceiling Drama Uplift Gold Price?
Commodities / Gold & Silver 2023 Apr 29, 2023 - 08:16 PM GMTBy: Submissions
 While the 2011 analog paints an optimistic portrait for gold, silver and mining stocks, a re-enactment of the last debacle is unlikely to unfold this time around. Back then, gold soared amid the debt ceiling chaos, while the USD Index was a major casualty. And while it’s possible lawmakers could ignite a similar event, most learn from their past mistakes.
For example, while bloated stock valuations were the Black Swan in 2000, the 2008 global financial crisis (GFC) was a housing market phenomenon, while the 2020 pandemic was a health scare. As a result, different catalysts often cause distress, and when this recession arrives, it will likely be driven by something investors least expect.
So, with the debt ceiling drama highly anticipated, it reduces the odds of the event unfolding in line with investors’ expectations. Therefore, it’s likely more semblance than substance, and the bulk of the PMs’ rallies should be in the rearview.
Here Comes the USD Index
As evidence, the USD Index has suffered recently, and there are concerns that the ECB could out-hawk the Fed. Well, the reality is that the EUR/USD has largely benefited from a resilient U.S. stock market and low volatility.
Please see below:
To explain, the green line above tracks the daily movement of the EUR/USD, while the black line above tracks the inverted (down means up) daily movement of the Cboe Volatility Index (VIX).
If you analyze the relationship, you can see that the currency pair has moved opposite the VIX for nearly a year. Moreover, when the VIX falls and risk-on sentiment reigns, currencies like the euro rally at the expense of the U.S. dollar. However, the environment should flip as we move forward. We wrote on Apr. 21:
To explain, the candlesticks above track the weekly movement of the VIX, while the black line at the bottom tracks its weekly RSI. If you analyze the horizontal green line, you can see that weekly VIX RSI readings below 40 are rare over the last 10+ years.
We added:
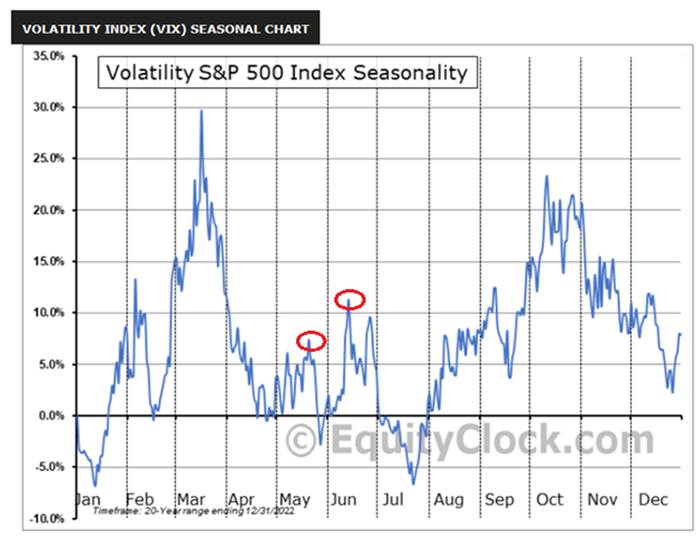
To explain, the blue line above shows how the VIX often bottoms near the end of April, then rises in May, falls again, then hits a new high in June. So, with the VIX’s clock turning bullish after next week, coupled with the rare weekly RSI reading, the data supports more uncertainty.
Thus, while the VIX declined dramatically on Apr. 27, the seasonal weakness is normal. Likewise, its weekly RSI did not make a new, and the shallow reading near 40 highlights how complacency should haunt the bulls in May and June.
To that point, the USD Index showcases seasonal strength in May and July.
Please see below:
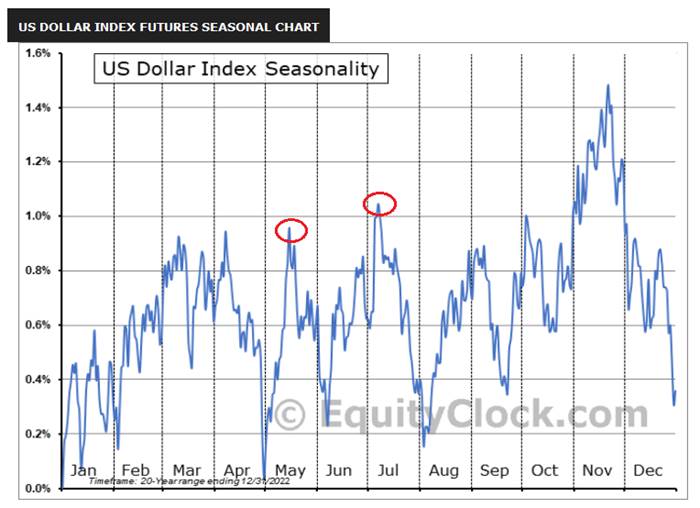
To explain, the blue line above shows how it’s perfectly normal for the USD Index to bottom at the end of April. Then, a sharp rally often follows in early May, followed by a pullback, then another breakout to new highs. Therefore, while the crowd assumes April’s winners will maintain their outperformance, if the VIX and the USD Index jump, the PMs’ trends should turn bearish.
Finally, while investors assume that rate cuts are on the horizon, the data suggests otherwise. Despite inflation fatigue causing investors to ignore the ramifications, the pricing pressures remain problematic and the year-over-year (YoY) base effects end in June. As a result, the month-over-month (MoM) readings will matter more, and the implications are far from priced in.
Please see below:
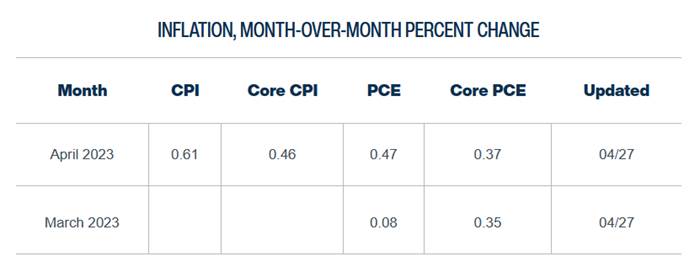
To explain, the Cleveland Fed expects the headline CPI to increase by 0.61% MoM in April, which, if realized, would be the highest MoM reading since June 2022. And while the Cleveland Fed has been off on its headline CPI predictions, its core CPI estimates have been accurate. As such, 0.46% MoM annualizes to 5.66% YoY, and a continuation of the theme will look even worse after June.
Overall, we believe the Fed’s tightening cycle has more room to run, and a realization is bullish for the USD Index and real interest rates. In addition, we’re days away from the calendar turning bullish for the greenback, and with risk assets rallying in April, investors loosened financial conditions, which uplifts inflation. Thus, don’t be surprised if the narrative shifts dramatically in the months ahead.
Will April’s winners suffer in May and June, or will their bullish trends continue?
By Alex Demolitor
Alex Demolitor hails from Canada, and is a cross-asset strategist who has extensive macroeconomic experience. He has completed the Chartered Financial Analyst (CFA) program and specializes in predicting the fundamental events that will impact assets in the stock, commodity, bond, and FX markets. His analyses are published at GoldPriceForecast.com.
Disclaimer
All essays, research and information found above represent analyses and opinions of Alex Demolitor and Sunshine Profits' associates only. As such, it may prove wrong and be a subject to change without notice. Opinions and analyses were based on data available to authors of respective essays at the time of writing. Although the information provided above is based on careful research and sources that are believed to be accurate, Alex Demolitor and his associates do not guarantee the accuracy or thoroughness of the data or information reported. The opinions published above are neither an offer nor a recommendation to purchase or sell any securities. Mr. Radomski is not a Registered Securities Advisor. By reading Alex Demolitor reports you fully agree that he will not be held responsible or liable for any decisions you make regarding any information provided in these reports. Investing, trading and speculation in any financial markets may involve high risk of loss. Alex Demolitor Sunshine Profits' employees and affiliates as well as members of their families may have a short or long position in any securities, including those mentioned in any of the reports or essays, and may make additional purchases and/or sales of those securities without notice.
© 2005-2022 http://www.MarketOracle.co.uk - The Market Oracle is a FREE Daily Financial Markets Analysis & Forecasting online publication.


