


Current State of the UK Housing Market as Stocks Climb a Wall of Worry
Housing-Market / UK Housing Jul 26, 2023 - 09:16 PM GMTBy: Nadeem_Walayat

Dear Reader
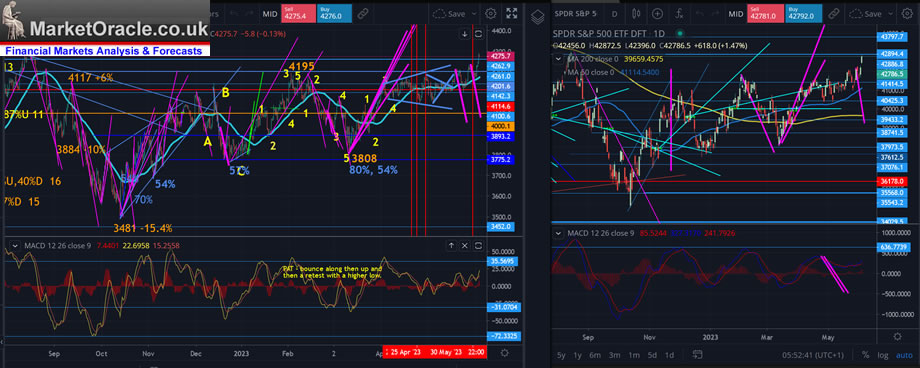
The stock market is literally climbing a wall of worry, refusing to give any opportunity for the mass of investors sat on the sidelines to jump on board the AI gravy trains unless they buy the highs! Most AI tech stocks are now very overbought i.e. Nvidia, Microsoft, Apple, KLAC, AVGO which had an insane spike last week to $933 that triggered one of my distant SELL limit orders at $899 (current $812).
Whilst many are very overbought that does not mean they cannot become more overbought! This is the problem with TA, the charts tells you that markets are over bought and ripe for a correction, and so one anticipates a fat juicy correction to accumulate into on buying opps perhaps down to below S&P 4000, but as I often state Technical Analysis on it;s own is a coin flip, and worse still is that which most focus on the S&P which is a RED HERRING! Put the two together and you can see how easy it is for most investors to be constantly wrong footed by a. focusing on the S&P and b. not realising that TA is not that reliable going forward, in hindsight its perfect, but going forward it's at best 55/45. One has to go beyond the charts and crunch the numbers and understand the fundamentals that differ for every stock.
Against this there is -
a. The TREND which refuses to point blank DROP, the S&P is making higher highs and lows WHILST OVERBOUGHT.
b. Most investors had been convinced by the cartoon network (CNBC) that the debt ceiling nothing burger was going to be catastrophic for stock prices hence record amounts of cash are parked in money market accounts, there just aren't enough actual bulls for this market to drop hard!
c. The June rate hike that is now the focus of attention could turn out to be another nothing burger, why? Because the market is going higher!
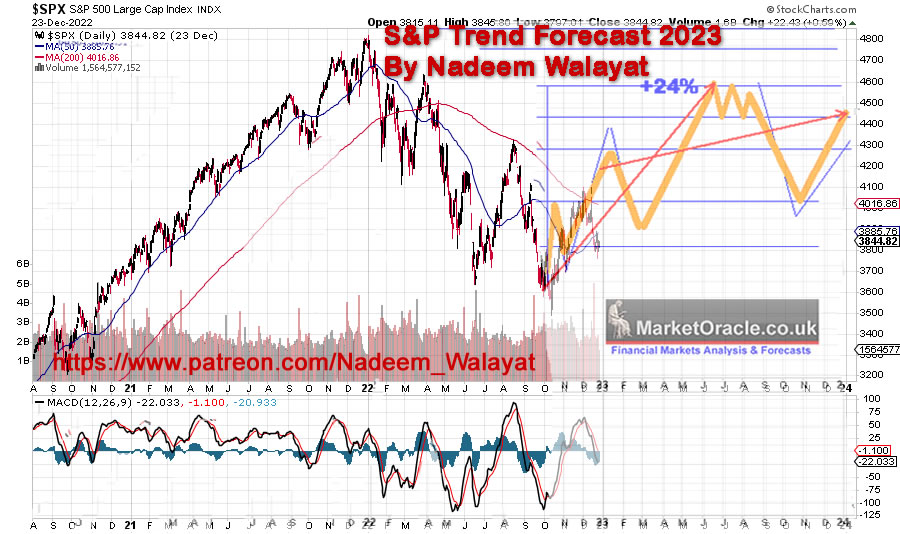
d. The roadmap that is blind to all of the nothing burgers is telling me, you, everyone we are heading for 4500 this summer, it's now June, so 2-3 months, so can we really fall to sub 4000 and then go to 4500? There has to be the time for such trends to manifest themselves.
(Stocks Bear Market Max PAIN - Trend Forecast Analysis to Dec 2023 - Part1 )
e. June seasonally is supposed to be a weak month, so technically being at the high going into June this 'should' be setting us up for a decent correction, there it is again Technical reasons which just are NOT working right now. Technically everyone who looks at a chart has been on the WRONG side of the markets, shorting it as it goes higher all the way until they thrown in the towel and cover and THEN it corrects!
YES it is a fact that most traders are BEARISH and most investors are sat on the sidelines as illustrated by my last article.
This BULL MARKET is not making it easy for those who want to buy to BUY! I have often written over the years that you will know when AI has taken control when AI tech stock prices are inexplicably keep climbing higher,it could be now!
There are still cheap stocks out there in the unloved sectors such as financials (GPN) and healthcare (Pfizer, ABBV), and even a few tech stocks are in or near the zone - CRUS, HPQ, QCOM, so not being crippled to fall into the trap of following the indices there are nearly always opportunities to accumulate. In terms of trimming, I'm done unless the AI tech stocks ramp higher by another 15% to 20% to trigger more sell limit orders.
The bottom line is we have ALWAYS been heading for S&P 4500, which means June will see the S&P trade above 4300 which would set the scene for 4500 during July as I cannot see how sub S&P 4000 during June can deliver 4500 by Mid August by the latest, there is just not enough time for that to play out despite personally being positioned to capitalise on a correction that now may not materialise until later in the year, you don't always get what you want. So if the FOMIO continues I'll trim a further 2 to 4% , if the S&P does decide to drop to say 4000 I'll probably buy about 3% to 6%. it could be worse, could be parked in money market accounts wishing I had not listened to the cnbc cartoon network when stocks were cheap when they peddled their buy t-bills, sell the finished big cap tech stocks line that likely prompted many investors to do the opposite of what they should have done at the time.
This article on the state of the stocks bull market & UK housing market Current State of the UK Housing Market as Stocks Climb a Wall of Worry was first made available to patrons who support my work.So for immediate first access to ALL of my analysis and trend forecasts then do consider becoming a Patron by supporting my work for just $5 per month. https://www.patreon.com/Nadeem_Walayat.
Also gain access to my exclusive to patron's only content such as How to Really Get Rich!
Change the Way You THINK! How to Really Get RICH Guide 2023

AI Stocks Portfolio
The Spreadsheet continues to undergo improvements, columns have been updated, the formulae for fair value has been revamped as it was calcing Micron as -4. now $52. the Investing guide has been expanded and will continue to be added to over time, and a couple of charts have been added - Percent Invested Chart which shows how the value of my AI holdings have changed since November 2022 when the table was last sorted in order of value of holdings. Also added is the minor swings chart that illustrates why I consider June 2022 to be the technical low even though it was not the actual low in terms of stock prices as there has been a steady progression from bear to bull since as manifesting in the reduction of volatility as bull markets are far less volatile than bear markets.
Portfolio Google spreadsheet - https://docs.google.com/spreadsheets/d/13gDntQuyDP3db7WqEvOXftOxVVTJyYyB_s-O0XW2EIk/edit?usp=sharing
AI Stocks Flashing Red Lights in the Chernobyl Control Room (3 or more).

AMD - 5 Red Lights
Nvidia - 4 Red Lights
Apple - 4 Red Lights
ABBV - 4 Red Lights
Intel - 4 Red Lights
Micron - 3 Red Lights
Amazon - 3 Red Lights
In terms of fairly valued - Broadcom despite it's parabolic bull run, Google, TSMC, META, AMAT, LRCX, Pfizer, so whilst NOT CHEAP. these are not at FOMO valuations, I would definitely eye accumulating on the next dip.
That's right Broadcom is CHEAP! Something you won't know if you just focus on the stock chart!
Medium risk - WDC 6 RED Lights! is looking very dangerous. whilst there is a sea of EGF reds across the medium and high risk stocks which suggests they are undergoing Q2 pain, Q2 and Q3 will be painful economic quarters, US could dodge negative GDP for Q2 but Q3 looks set to be negative, though one quarter of negative GDP is not going to be enough to call an recession.
Bottom line stocks soaring with negative EGF's suggests we are in a bit of a FOMO phase that I am capitalising on by trimming as opps arise and where the metrics are flashing RED WARNIGS such as for Micron, it's the best one can do without the benefit of hindsight so I will continue trimming into the rally should it continue!
Will UK House Prices Crash 2023?
First a reminder of some of the primary drivers for UK house prices (in order of importance).
1. Population Growth
2. Inflation courtesy of money printing.
3. Growing economy.
4. Insufficient new housing construction.
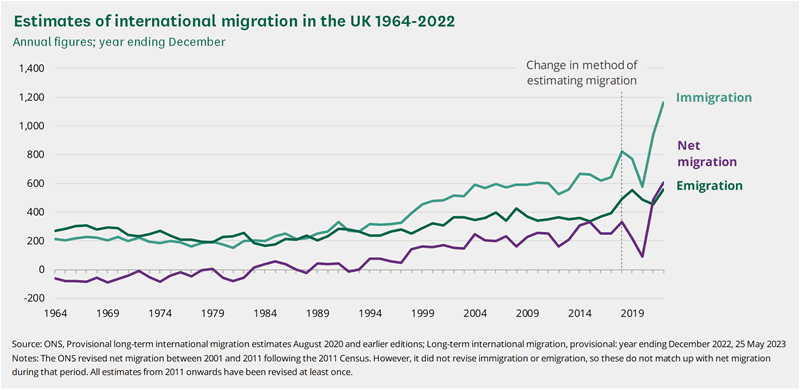
Note these are all interlinked and not independant factors i.e. you don't get population growth unless you have a growing economy as a stagnating economy results in EMIGRATION as was the case for the UK during the 1960's and 1970's as Canada and Australia hoovered up million of Brit's to populate their sparsely populated cites to ward of threats of invasion from the north (Australia) and South (Canada).
In terms of the metrics nothing much has changed since my in-depth analysis of early April 2022 (UK House Prices Trend Forecast 2022 to 2025), population continues to soar as illustrated by the latest net migration statistics that hit a a new record high of 606,000 for 2022 when the target is supposed to be 50,000! So much for Brexit!
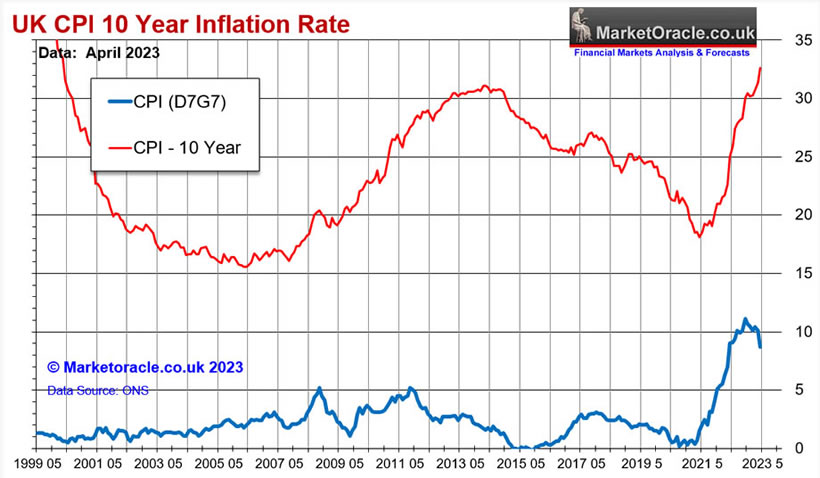
Whilst the UK economy is weak however one only needs to look at the basket case that is France to see how much worse others are fairing. Whilst house building NEVER lives up to the political promises, coming in at near HALF the targets. Meanwhile inflation despite Rishi's tweets of coming under control remains largely out of control even under their fake CPI:LIE measure.

As I stated BEFORE inflation took off into the stratosphere that the eventual drop in CP LIE won't make any difference to the real inflation pain that people will face as illustrated by the 10 year inflation graph.
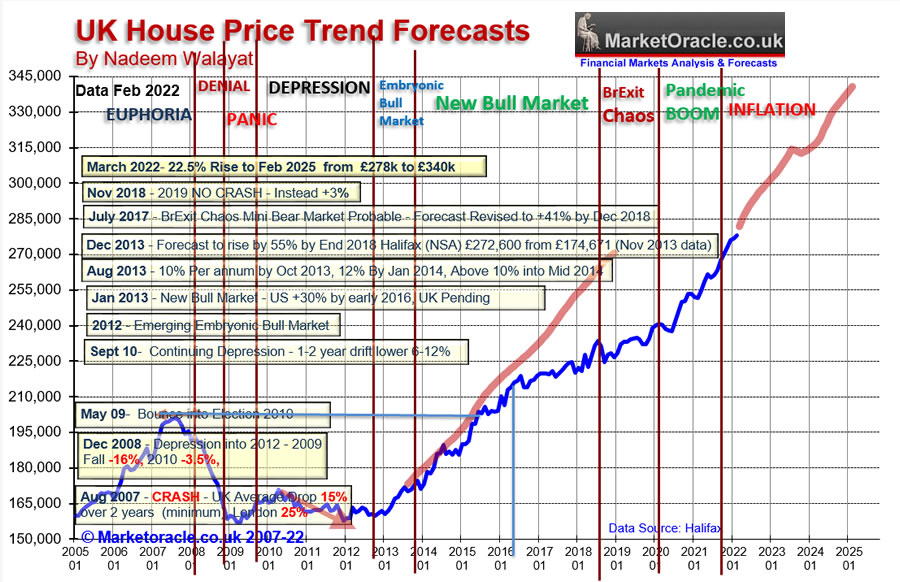
UK House Prices Trend Forecast 2022 to 2025
UK House Prices 2022 to 2025 Trend Forecast Conclusion
My expectations are for for average UK House prices (Halifax) to continue to trend higher over the next 3 years, punctuated by a brief pause during early 2023 in response to interest rate hikes, weakening economy and tax rises. However persistent high inflation, extreme over crowding and continuing strong population growth ensures that the bull market will remain in tact. Therefore my forecast conclusion is for average UK house prices (Halifax) to target a rise from £278,123 as of February 2022 over the next 3 years to £340,632 for February 2025 data (Halifax) targeting a price increase of 22.5% over 3 three years as as illustrated by my trend forecast graph below
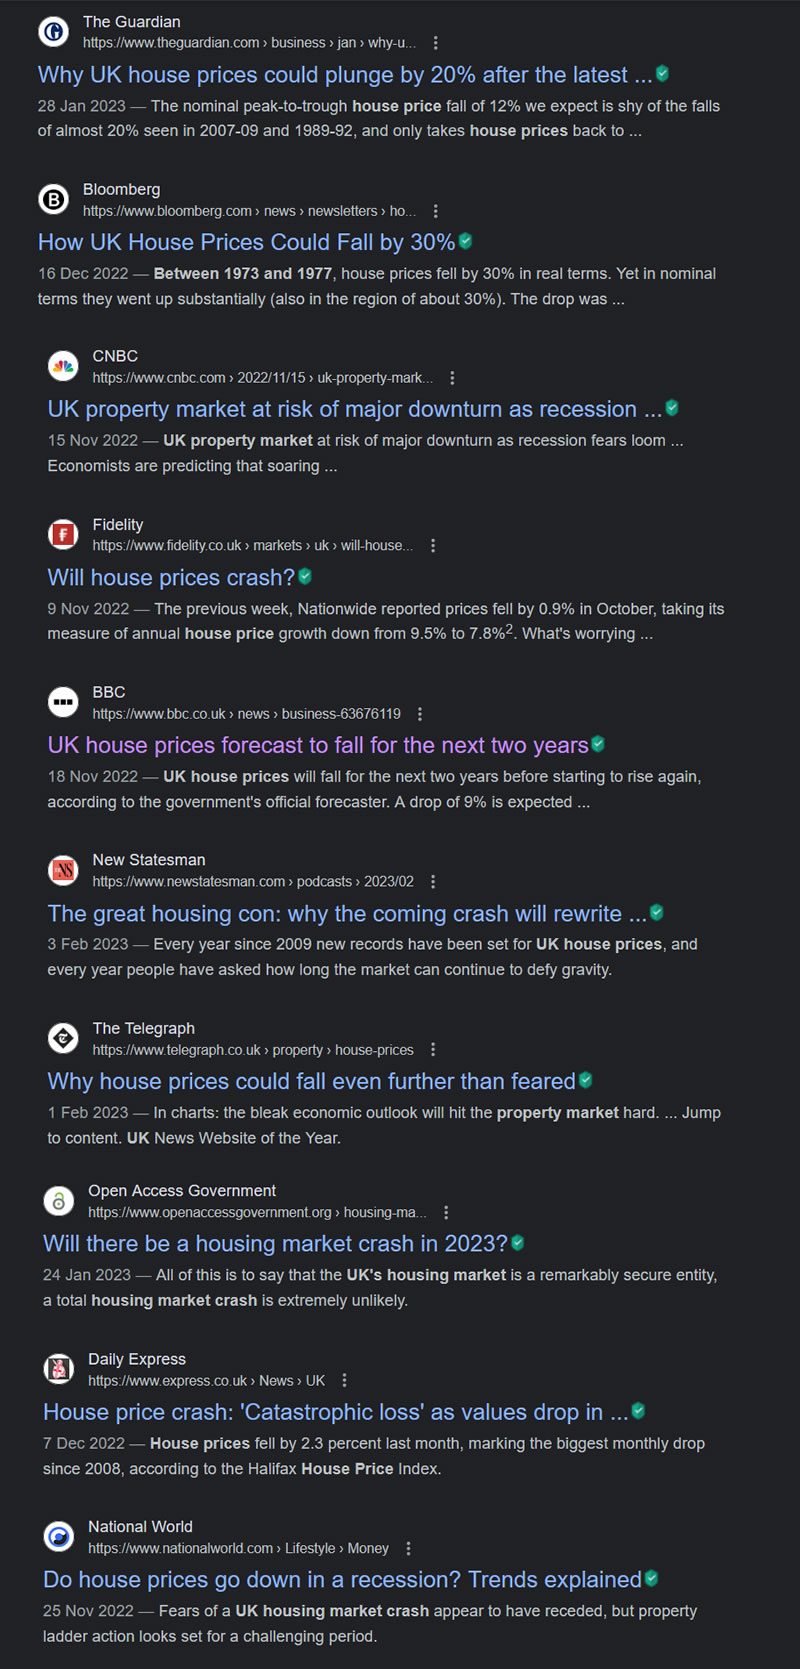
So has the doom and gloom for UK house prices that MSM has been iterating for many years, long before the pandemic of 2020 finally materialised in the wake of interest rate hikes to bring out of control inflation under control? One things for sure the mainstream media is consistent! One could literally pick stories from any year over the past decade and you would get the SAME headlines!
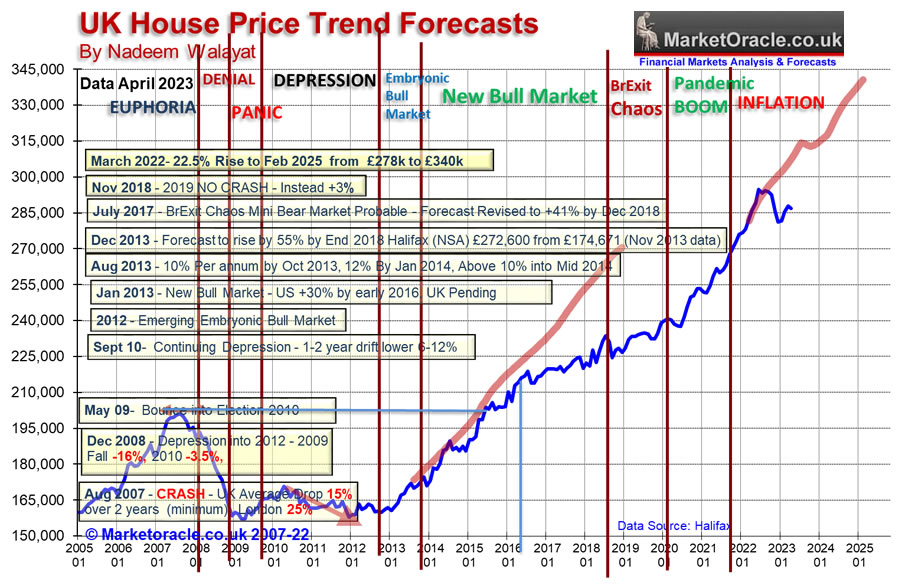
Uk house prices as measured by the Halifax at the time of my trend forecast were £278,123, the initial trend for the first 6 months was inline with the trend forecast until it was hit by the Liz Truss credit freeze last October when the UK came to within hours of financial collapse, I am not exaggerating! One only needs look at what happened to sterling to see the magnitude of the self inflicted crisis that hit the UK economy hard which the government and the Bank of England since have been desperately trying to instill confidence in the UK bond market to limited success. You have to remember at the time of my forecast no one knew who Quasi Modo and Liz Trustless were let alone that they would seize the reigns of power for a catastrophic 6 weeks!
So UK house prices took a hit and thus now sit on a deviation of -6% against the trend forecast, given that the UK rate hike cycle is not finished i.e. we are likely see base rates above 5% (current 4.5%), then at best we are going to see UK house prices stagnate until the Bank of England is done before the trend proper resumes, at worst drift lower but NO CRASH!.So I see further stagnation for a good 4 to 5 months before the bull trend resumes towards trend, playing catch up during the built in weakness that was forecast for llate 2023.
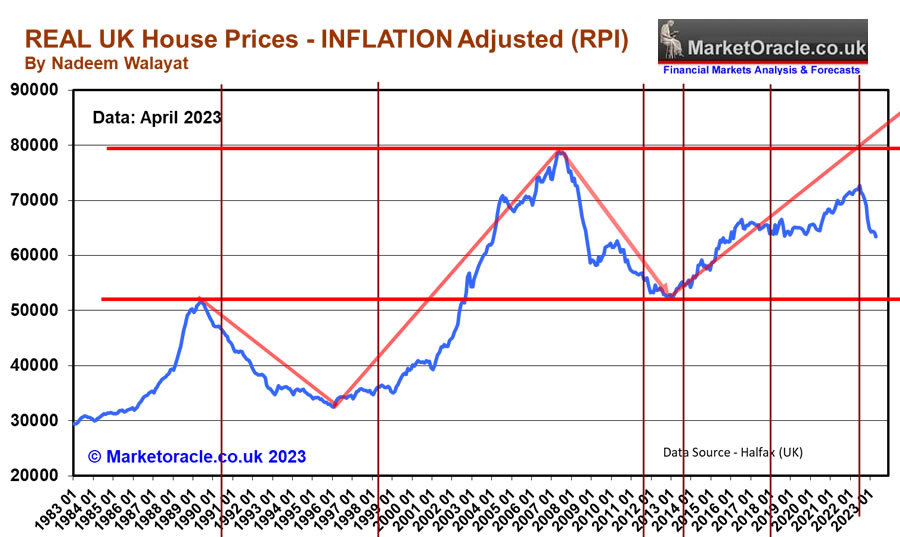
It should not be forgotten that the primary drivers as mentioned above remain in force, so whilst the mainstream press is focused on prospects for a fall in the headline rate in UK house prices, what they are completely blind to is the stealth fall in house prices underway in real terms so are destined to once more be caught wrong footed as UK house prices begin to inexplicably start to climb the wall of worry instead of CRASHING by 20% as many are forecasting.
Another indicator that UK house prices are preparing for a resumption of the bull market is that all of the irrational exuberance of last year has now left the building as illustrated by the momentum graph which suggests to expect an upwards surprise during late 2023.
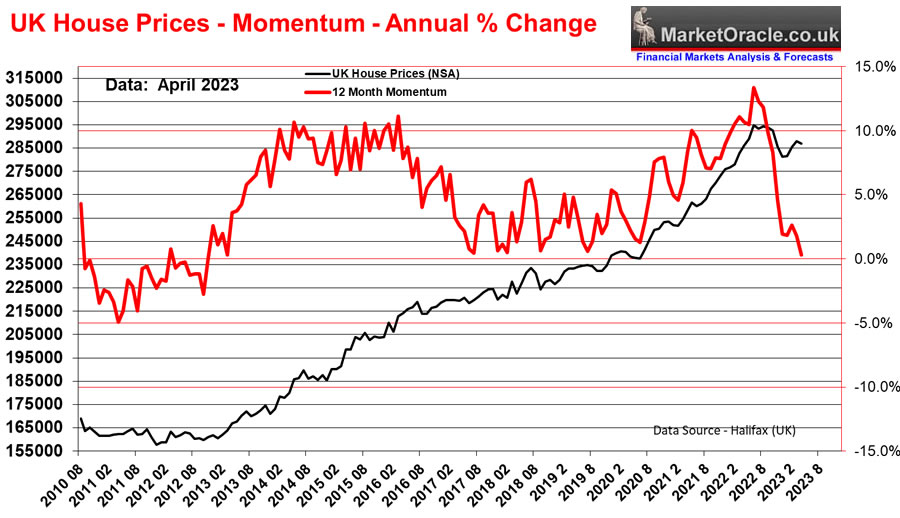
So will house prices crash 2023?
Anything is possible but it's definitely NOT PROBABLE, not unless we witness a repeat of October 2022 but even that failed too retrace more than a few months of rise, so no I don't see a UK house prices crash during 2023, in fact I suspect we will see an upside surprise, maybe even see average UK house prices hit new all time highs before the end of this year i.e. above £294,000.
My next article will include a similar look at the current state of the US Housing Market.
This article on the state of the stocks bull market & UK housing market Current State of the UK Housing Market as Stocks Climb a Wall of Worry was first made available to patrons who support my work.So for immediate first access to ALL of my analysis and trend forecasts then do consider becoming a Patron by supporting my work for just $5 per month. https://www.patreon.com/Nadeem_Walayat.
For Immediate first access to ahead of the curve analysis as my extensive analysis of the stock market illustrates (Stocks Bear Market Max PAIN - Trend Forecast Analysis to Dec 2023 - Part1), that continues on in the comments section of each posted article, all for just 5 bucks per month which is nothing, if you can't afford 5 bucks for month then what you doing reading this article, 5 bucks is nothing, if someone did what I am doing then I would gladly pay 5 bucks for it! Signup for 1 month for a taste of the depth of analysis that cannot be beat by those charging $100+ per month! I am too cheap! I am keeping my analysis accessible to all, those willing to learn because where investing is concerned the sooner one gets going the better as portfolios compound over time, $5 month is nothing for what you get access to so at least give it a try, read the comments, see the depth of analysis, you won't be sorry because i do do my best by my patrons, go the extra mile.
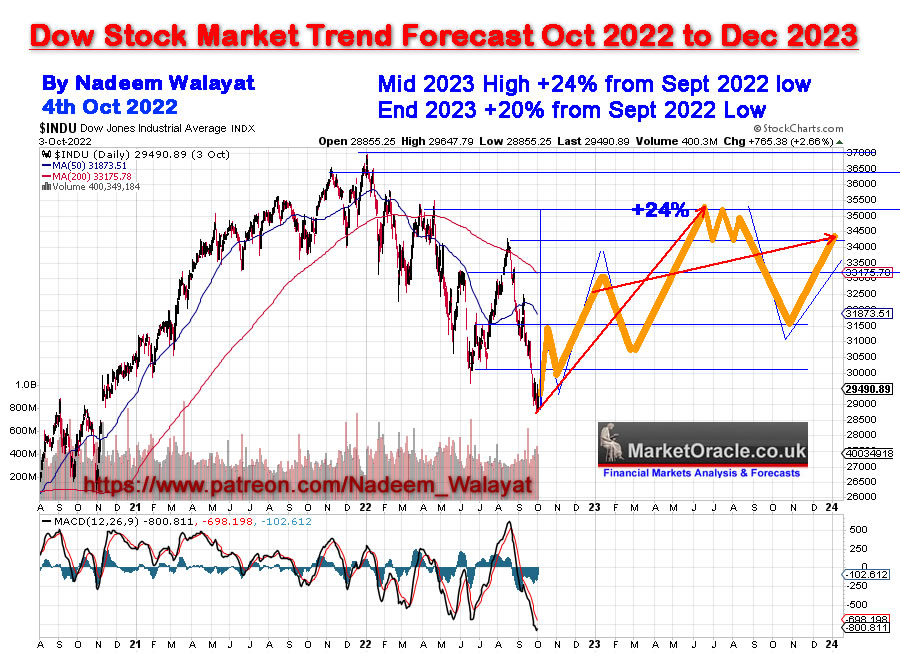
S&P
Targeting 4600 Mid Summer 2023.

And gain access to the following most recent analysis -
- Change the Way You THINK! How to Really Get RICH Guide 2023 - by Nadeem Walayat
- Stocks Bull Market Phase One End Game Sector Rotation
- Stock Market FOMO Maniacs Rug Pull Imminent? US House Prices Trend Current State
- Current State of the UK Housing Market as Stocks Climb a Wall of Worry
- Can AI Tech Stocks Mania Push the S&P Through 4300?
- Stock Market Fundamentals, Debt Ceiling Smoke and Mirrors Circus
So for immediate first access to to all of my analysis and trend forecasts then do consider becoming a Patron by supporting my work for just $5 per month. https://www.patreon.com/Nadeem_Walayat.
My Main Analysis Schedule:
- How to Get Rich - FINISHED - Change the Way You THINK! How to Really Get RICH Guide 2023 - by Nadeem Walayat
- US House Prices Trend Forecast - 50%
- Global Housing / Investing Markets - 50%
- US Dollar / British Pound Trend Forecasts - 0%
- High Risk Stocks Update - Health / Biotech Focus - 0%
- State of the Crypto Markets
- Gold and Silver Analysis - 0%
Again for immediate access to all my work do consider becoming a Patron by supporting my work for just $5 per month. https://www.patreon.com/Nadeem_Walayat.
And ensure you are subscribed to my ALWAYS FREE newsletter for my next in-depth analysis.
Your trimming into the FOMIO rally analyst.
By Nadeem Walayat
Copyright © 2005-2023 Marketoracle.co.uk (Market Oracle Ltd). All rights reserved.
Nadeem Walayat has over 30 years experience of trading derivatives, portfolio management and analysing the financial markets, including one of few who both anticipated and Beat the 1987 Crash. Nadeem's forward looking analysis focuses on UK inflation, economy, interest rates and housing market. He is the author of five ebook's in the The Inflation Mega-Trend and Stocks Stealth Bull Market series that can be downloaded for Free.


 Nadeem is the Editor of The Market Oracle, a FREE Daily Financial Markets Analysis & Forecasting online publication that presents in-depth analysis from over 1000 experienced analysts on a range of views of the probable direction of the financial markets, thus enabling our readers to arrive at an informed opinion on future market direction. http://www.marketoracle.co.uk
Disclaimer: The above is a matter of opinion provided for general information purposes only and is not intended as investment advice. Information and analysis above are derived from sources and utilising methods believed to be reliable, but we cannot accept responsibility for any trading losses you may incur as a result of this analysis. Individuals should consult with their personal financial advisors before engaging in any trading activities.
Nadeem Walayat Archive |
© 2005-2022 http://www.MarketOracle.co.uk - The Market Oracle is a FREE Daily Financial Markets Analysis & Forecasting online publication.