Dow Jones Hits New Highs in Lead up the Mid-term Elections
Stock-Markets / US Stock Markets Oct 09, 2006 - 05:00 PM GMTBy: Nadeem_Walayat
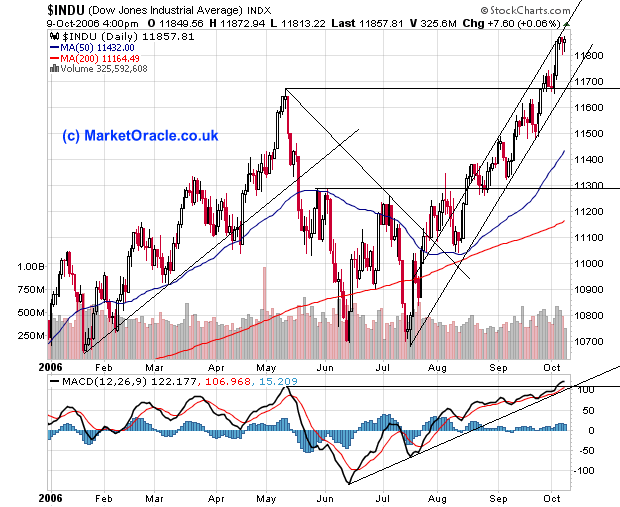
The Dow Jones has fulfilled the price pattern identified in the July Analysis , having strongly marched higher as buyers rely on the pattern of buying into the run up to the Election as a self fulfilling prophecy, despite the bad news around growth, inflation and interest rates.
The Dow is likely to continue to hold into the Elections and then correct. The degree of correction depends on how high the market goes between now and the elections, but regardless of the results a correction is expected, as both the Dow and other Stock Markets squeeze in the usual Seasonal bull run into December into October instead.

Despite the seasonal influences and despite the bad news, key points about the Dow high being breached need to be taken into account i.e. -
1. That earnings have grown since 2000 by over 60%
2. That inflation means the dow is lagging in real-terms i.e. the current high in real terms is below that of 2000.
3. That bad performing stocks have been removed from the index, and replaced by better performers.
4. That the way the Dow is constructed, means that fewer high prices gaining stocks have a greater weight over lower priced bigger cap, losing stocks.
5. The Dow Jones is a small index of stocks, making it open to market manipulation to some degree.
Technical Analysis
1. Price Patterns - The Dow has reached its price target from the double bottom, breaking out to new highs. Now the next price pattern target would be the high of 11680+ the range 1000 = 12680.
2. Divergence - Whilst the Dow has made high it has show divergence from other US markets including the Russell 2000 and Dow Transports, which is a sign of you could say market manipulation of a much smaller index. And portents to a strong correction following the US Election.
3.Resistance - The up channel line is containing the uptrend.
4. Support - Immediate minor support is 11,800, Main support is the previous high of 11,680.
5. MACD - (Bottom indicator) - The MACD again has worked its way into an overbought state, which suggests that the Dow will find it tough going from now on for at least a week or so as it works out the overbought state and may decline a little.
6. 40 week Moving Average - This will likely contain any correction and currently is at 11,440
7. Uptrend Line - .Implies minor support at 11,700, though is unlikely to hold other than in the short-term.
8. Time - The Dow appears to have compressed its end of year rally into the lead up to the mid-term elections.
Conclusion - The Dow is likely to find the next two weeks tough, and could fall towards support at 11,680, before a run up to the elections (dependant on support holding).
Buy Trigger - The Dow would be a buy from a bounce at 11,680 or a break to new highs.Target - The Dow is targeting new highs, with pattern projections to 12,680.
Stop-Loss - The best stop loss level would be 11,470, as volatility to the downside is expected over the coming weeks.
Nadeem Walayat
(c) MarketOracle.co.uk 2005-2006
Disclaimer - This Analysis / Forecast / Trade Scenerio is provided for general information purposes only and not a solicitation or recommendation to enter into any market position, and you are reminded to seek independent professional advice before entering into any investments or trading positions.The Market Oracle is a FREE Financial Markets Forecasting & Analysis online publication. We aim to cut through the noise cluttering traditional sources of market analysis and get to the key points of where the markets are at and where they are expected to move to next ! http://www.marketoracle.co.uk
This article maybe reproduced if reprinted in its entirety with links to http://www.marketoracle.co.uk
© 2005-2022 http://www.MarketOracle.co.uk - The Market Oracle is a FREE Daily Financial Markets Analysis & Forecasting online publication.


