


Is a China-Taiwan Conflict Likely? Watch the Region's Stock Market Indexes
Stock-Markets / Chinese Stock Market Jun 30, 2024 - 04:06 AM GMTBy: EWI

By Mark Galasiewski | Elliott Wave International
The U.S. government in early May sanctioned 300 Chinese entities for supplying machine tools and parts to Russia for its war against Ukraine, while in mid-May Russian president Vladimir Putin made a two-day visit to China. In turn I found myself thinking about how tensions between China and the United States could lead to open conflict, specifically over Taiwan.
The likelihood of conflict depends in part on the region's social mood, as reflected in Asia's stock market indexes. When social mood is negative, countries are more likely to behave aggressively.
Tensions in the region have been high. On May 23, China conducted a military drill that sent 111 warplanes plus several navy destroyers and frigates close to Taiwan and its outer islands. China said the drill meant to punish Taiwan for an offense committed by its new head of state, Lai Ching-te, who used his May 20 inauguration speech to suggest that Taiwan is not part of China.
Yet China appeared to end the provocative move after just two days, much like Iran quickly ended its reprisal drone attack on Israel in April. Both examples reflect the desire to limit the scope of new conflicts, consistent with the improving social mood and burgeoning rally in emerging markets.
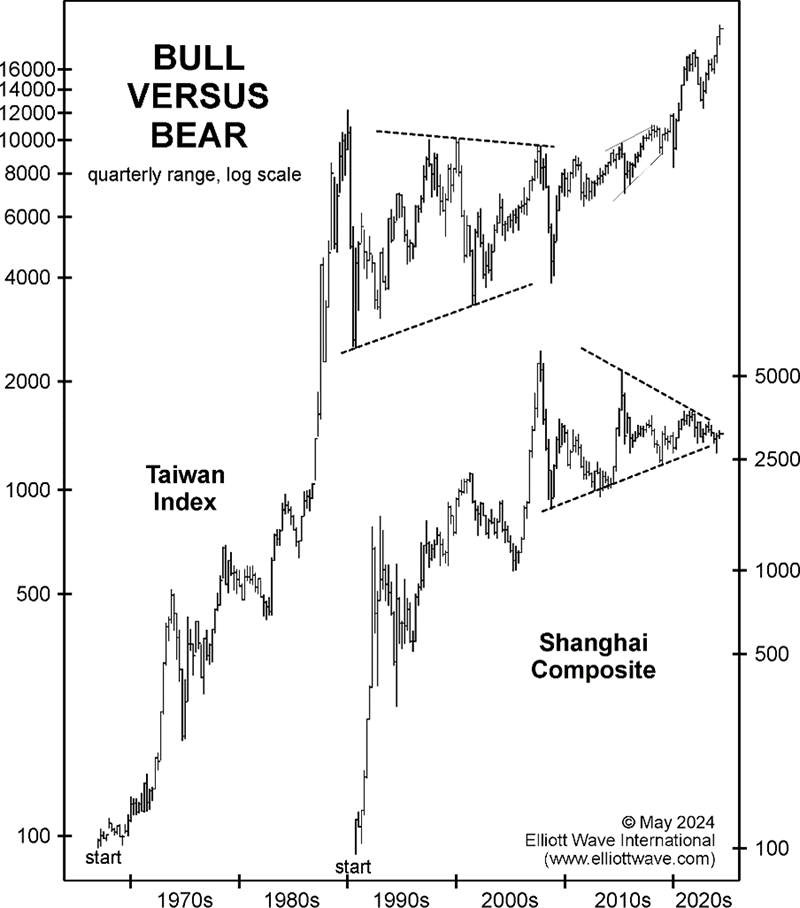
As our "Bull versus Bear" chart shows, the mood in Taiwan remains positive amid the global tech boom: The Taiwan Index rose right through the military drill. In contrast, the mood in China remains severely negative, as reflected in the Shanghai Composite's long-term pattern. That does raise the risk of Chinese aggression -- or at the least increases the risk of accidents and miscalculations. As Singapore's deputy prime minister Gan Kim Yong recently said at the Nikkei Forum in Tokyo, bad outcomes tend to follow during periods "when each side views the other as an adversary."
Some geopolitical observers frame the Russia-Ukraine conflict as a proxy battle in a new cold war between the United States and its democratic allies, versus the China-dominated axis of autocratic states that includes Russia, North Korea and Iran.
Long-term charts offer perspective.
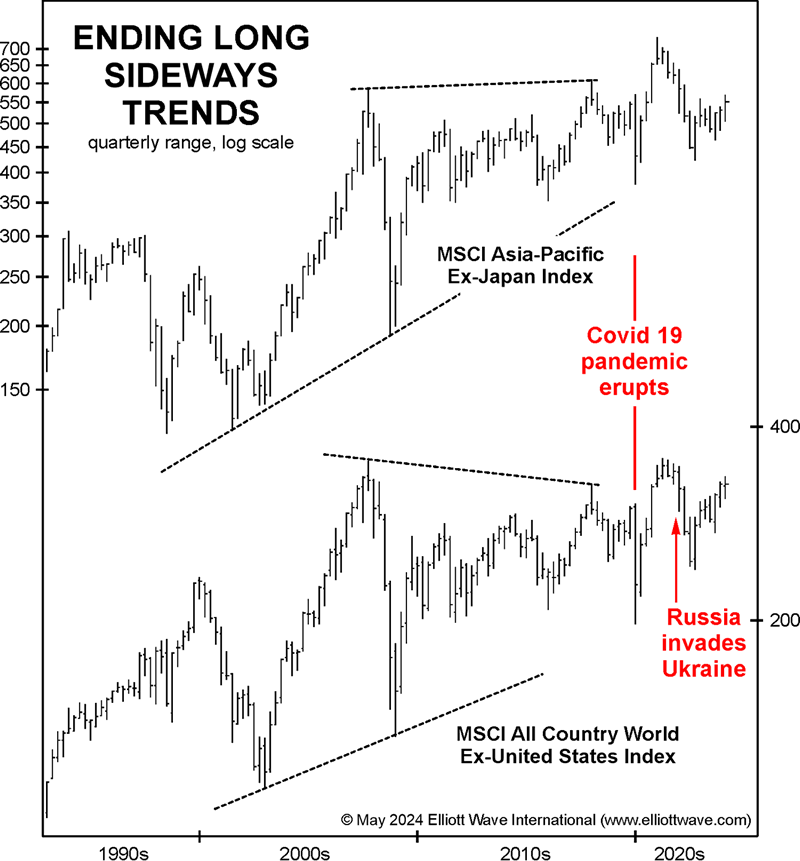
In 2020, the MSCI Asia-Pacific Ex-Japan Index ended a 26-year sideways pattern, while the MSCI World Ex-U.S. Index ended its own, similar 20-year-long sideways trend. This two-decade period is comparable to the 1929-1949 corrective period in the U.S. stock market. The Covid pandemic erupted toward the end of the triangless much like the 1948-1955 polio epidemic spread across the globe and killed half a million people a year at its peak.
The first proxy battle in the current cold war -- Russia-Ukraine -- erupted two years post-Covid during the correction in the index, much like the first proxy battle -- the Korean War -- in the earlier Cold War erupted in 1950 and lasted until 1953. The Russia-Ukraine war could follow that precedent by ending in a stalemate sooner than most observers imagine, even as the developing bull market in world ex-U.S. stocks contributes to years of relative peace. Then, once China becomes much stronger militarily, the next proxy battle in the cold war rivalry -- perhaps over Taiwan -- would be analogous to the Vietnam War when the U.S. dramatically escalated the fighting in 1965 and pulled out eight years later, as the communist government of North Vietnam in turn took over South Vietnam to reunite the country.
We're watching the region's stock market indexes closely.
If you'd like to learn more about Elliott wave price patterns, including the triangles mentioned above, EWI has made available the entire online version of the book Elliott Wave Principle: Key to Market Behavior.
This article was syndicated by Elliott Wave International and was originally published under the headline . EWI is the world's largest market forecasting firm. Its staff of full-time analysts led by Chartered Market Technician Robert Prechter provides 24-hour-a-day market analysis to institutional and private investors around the world.
© 2005-2022 http://www.MarketOracle.co.uk - The Market Oracle is a FREE Daily Financial Markets Analysis & Forecasting online publication.