


How Wars and Stock Market Rallies are Won
Stock-Markets / US Stock Markets Nov 09, 2008 - 06:49 AM GMTBy: Marty_Chenard

 Imagine a war where the battalion leader says, "Charge". The battalion moves forward, but as they do, they turn around and see the leader retreating. What do they do next? First, fear grips them as they know the leader is running from what he perceives as a grave danger. At best, the battalion loses their fervor for winning the charge, or retreats like their leader.
In the stock market, it can be said that there are two subsets of stocks ... Leadership stocks and Broad Market stocks. Their interaction behavior is much like the scenario between the battalion leader, and his troops.
In a battle, if the strength and confidence of the Leader is strong, it will effect the battalion in a positive way propelling them into battle with the fervor needed. In the stock market, it is not much different.
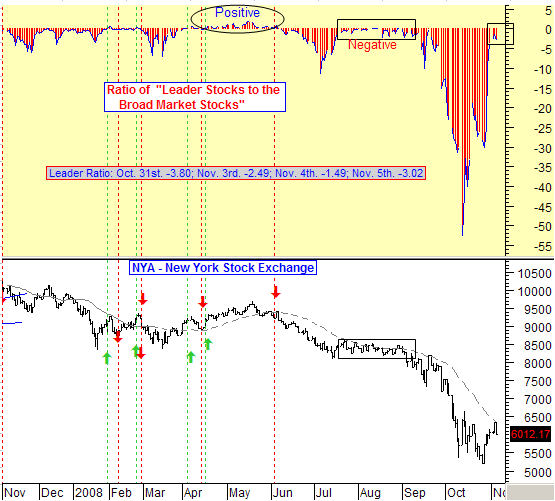
In today's Leadership Ratio chart, we measure the strength of the Leadership stocks and compare it to the strength of the Broad Market stocks. We then divide the two numbers and create a Ratio that shows if the Leaders are moving forward or retreating relative to the troops (the Broad Market stocks.)
So what is the Leadership Ratio saying?
1. That the Leaders are still in retreat.
2. That the Leaders are not retreating as fast and as far as they were retreating in October. They are at the lowest retreat level of the past two months.
None the less, they are still in retreat.
Leadership stocks have been in retreat for most of this year. The only exception was in April to early June where the Leadership Ratio was positive, signifying that the Leaders where ahead of the troops and leading them to a rally victory. That was the one best and longest rally period we saw this year.
During July to early September, our Leadership Ratio was in a slight retreat level that never managed to move positive and into a charge and leadership mode. The result was a sideways market movement that was never capable of producing a rally. And then, in mid September, the Leaders started retreating faster and further. The troops (Broad Market stocks) followed their Leaders and the market tumbled .
Many are excited every time the market appears to be trying for another rally. But ... that excitement will never be able to give them the sustained rally they want until the Leadership Ratio goes positive which always results with the troops rallying strongly behind their leaders .
Yes, it can be said that the Leadership stocks are getting very close to moving into a positive-charge condition. But, as investors have learned in the July to September time period, the Leadership stocks can remain in that low retreat condition for a long time, and then head for the hills in total fear.
The moral of the story is quite simple ... no battle is ever won by the troops when they see their leaders running away in fear. Battles are won when the leaders are in front of the charge leading their troops to victory. Rallies are the same ... they happen when the Leadership stocks are in front and leading an up move which pulls the Broad Market stocks up with them. The sustainable rally you have been waiting for and want, will only happen after the Leadership stocks come out of their retreat and lead the charge.
I hope you enjoyed today's update. As many of you know, this chart is a proprietary chart posted daily on our paid subscriber sites. In fairness to our subscribers, we will not post it again until close to the end of November on this free site.
One quick personal note ... We depend on "word of mouth" actions by visitors like yourself, telling others about our free daily update service. If you have enjoyed your daily updates and have found them beneficial, then please think about returning the favor and telling others about stocktiming.com. We do no paid advertising, so we count on each of you to help spread the word.
Many Thanks, Marty Chenard
_____________________________________________________________________
*** Feel free to share this page with others by using the "Send this Page to a Friend" link below.
By Marty Chenard
http://www.stocktiming.com/
Please Note: We do not issue Buy or Sell timing recommendations on these Free daily update pages . I hope you understand, that in fairness, our Buy/Sell recommendations and advanced market Models are only available to our paid subscribers on a password required basis. Membership information
Marty Chenard is the Author and Teacher of two Seminar Courses on "Advanced Technical Analysis Investing", Mr. Chenard has been investing for over 30 years. In 2001 when the NASDAQ dropped 24.5%, his personal investment performance for the year was a gain of 57.428%. He is an Advanced Stock Market Technical Analyst that has developed his own proprietary analytical tools. As a result, he was out of the market two weeks before the 1987 Crash in the most recent Bear Market he faxed his Members in March 2000 telling them all to SELL. He is an advanced technical analyst and not an investment advisor, nor a securities broker.
Marty Chenard Archive |
© 2005-2022 http://www.MarketOracle.co.uk - The Market Oracle is a FREE Daily Financial Markets Analysis & Forecasting online publication.