


Gold Trades Sideways Amidst Continuing Bearish Trend
Commodities / Gold & Silver Nov 09, 2008 - 08:27 AM GMTBy: Merv_Burak

 Having been away last week didn't seem to have made much difference. Gold is just about where it was when last I reviewed it here two weeks ago. The best that can be said is that it is building strength while moving in a basic lateral direction.
GOLD : LONG TERM - Since I last showed the long term P&F chart of gold in my 2008-10-17 commentary it had made a move to lower levels and then moved in a sideways path. It has formed a strong resistance at the $765 level so a move to $780 would be an upside break. It might also be a reversal to the bull as the down trend line is very close to that point.
It depends upon any further sideways movement prior to a break. Such a break, should it happen, would project to at least the $870 level, which would not indicate a very strong move. However, a move below the $705 level might indicate a bear trend continuation towards the present projections of $630 then $480. We'll just have to wait and see which way the wind is blowing.
As for the normal indicators, gold remains below its negative sloping moving average line and the momentum indicator remains in its negative zone just a shade below its negative sloping trigger line. The volume indicator is making new lows showing greater weakness than either the price or momentum. All in all, the long term rating remains BEARISH .
INTERMEDIATE TERM
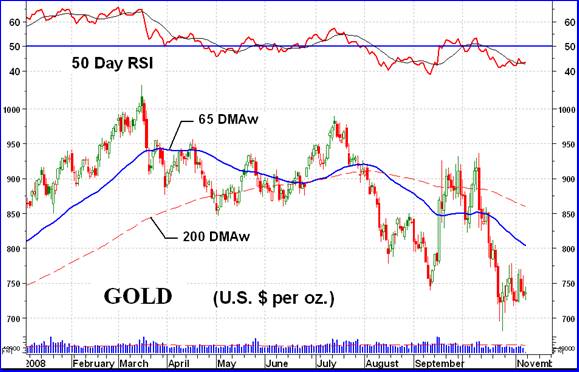
The chart clearly shows a bearish trend of lower highs followed by lower lows. Gold is quite a distance below its negative sloping moving average line. The volume indicator (not shown) is also into new lows below its negative sloping trigger line. The momentum indicator is also in its negative zone but is just above its trigger line attempting to move higher. The trigger is still, however, pointing downward. One positive in this picture is the location of the momentum indicator. While the price and volume have both moved into new low levels recently the momentum indicator remained above its previous low giving us a mild positive divergence. We'll just have to see how this develops. In the mean time, based upon the indicators as they are, the rating must remain BEARISH .
SHORT TERM
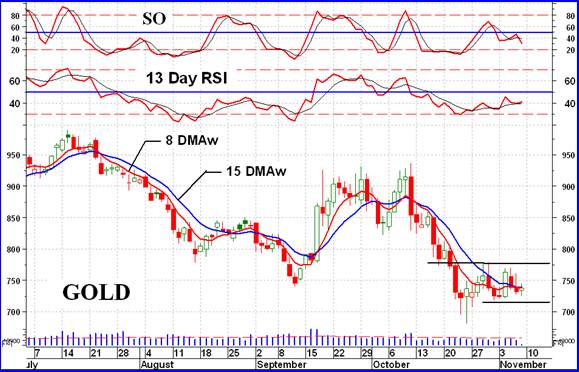
We're getting somewhat of a mixed picture from the short and very short term indicators. Gold has basically been moving sideways for the past two weeks but the indicators are all over the place. First, gold has been above and below its short term moving average line but the line remains in a negative slope. The very short term moving average line seemed to have bottomed out and appeared to be attempting to cross the short term line to the up side. However, the attempt has so far failed and the very short term line remains just a hair below the short term line. The short term momentum indicator, however, has been moving basically in an upward direction and remains above its positive sloping trigger line.
However, it still resides inside its negative zone. The daily volume action has not been impressive at all. Over the past few months it has remained mostly below its 50 day moving average line. This indicates a volume action that is getting fewer and fewer daily trades although the trend is not that noticeable. Although the momentum indicator has made a new short term movement high this past week (but still in the negative zone) the price could not breach its previous high. Will the price pull the momentum down with it or will the momentum strength pull the price up with it? We'll see this week. For now there remains only one rating for the short term and that is the BEARISH rating.
As for the direction of least resistance, the aggressive Stochastic Oscillator (SO) is suggesting very short term weakness by already moving below its previous lows unlike the price or short term momentum. The direction of least resistance therefore appears to be to the down side.
SILVER
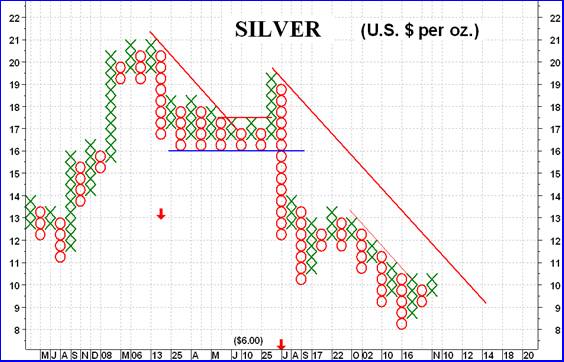
Since reaching its high in March silver has been a poor performer. Its latest projection is still to the $6.00 mark. This is really an average between two projections from its March to July consolidation period. One projection was to $5.50 while the other one was to $6.50, so I just took an average. Interesting to note that the projection calls for a further drop in silver price by 40% while at the same time the $480 projection for gold calls for a 35% drop in price. Close enough to consider both as equivalent projections.
There is nothing in the indicators different from that of gold. Price below negative moving average lines, momentum in the negative zone but showing a slight positive divergence and the daily activity in volume continuing to be weak and below its 50 day average volume. So, whatever the ratings were for gold could apply equally to silver.
PRECIOUS METAL STOCKS
Over the past few commentaries I have been showing you charts of the average performances of a sector in the precious metals. Today we look in on the Merv's Qual-Silver Index for the average performance of the 10 largest silver stocks.
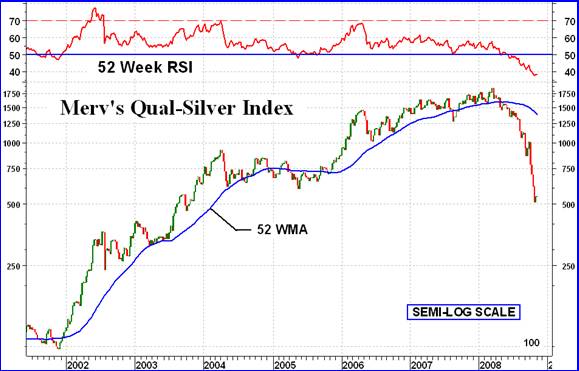
Over a period of just over 6 years the average price of this sector increased by a factor of over 17 times. In just ½ of a year the reversal cut that gain by three quarters. When the bear growls you'd better run, and fast. One can easily see the topping process for over a year with the momentum indicator getting weaker and weaker even as the Index was moving higher and higher. Here I show a very long term chart with a 52 week RSI and a simple 52 week moving average line. I guess the question on most speculator's minds is when will it bottom and turn around?
Well, there has been a lot of technical damage done and one would not expect a quick turn around. I would expect it to meander sideways for a while before turning around. That is not yet happening so maybe the projections for silver will cause further decline in the stocks. One should keep in mind that it would not be unusual for the stocks to actually turn around and start their bull move before the commodity actually bottoms out. It's a wait and see game. Let the charts tell you what IS HAPPENING and not try to jump the gun picking a bottom.
Merv's Precious Metals Indices Table
Let's call it another week.
By Merv Burak, CMT
Hudson Aero/Systems Inc.
Technical Information Group
for Merv's Precious Metals Central
For DAILY Uranium stock commentary and WEEKLY Uranium market update check out my new Technically Uranium with Merv blog at http://techuranium.blogspot.com .
During the day Merv practices his engineering profession as a Consulting Aerospace Engineer. Once the sun goes down and night descends upon the earth Merv dons his other hat as a Chartered Market Technician ( CMT ) and tries to decipher what's going on in the securities markets. As an underground surveyor in the gold mines of Canada 's Northwest Territories in his youth, Merv has a soft spot for the gold industry and has developed several Gold Indices reflecting different aspects of the industry. As a basically lazy individual Merv's driving focus is to KEEP IT SIMPLE .
To find out more about Merv's various Gold Indices and component stocks, please visit http://preciousmetalscentral.com . There you will find samples of the Indices and their component stocks plus other publications of interest to gold investors.
Before you invest, Always check your market timing with a Qualified Professional Market Technician
Merv Burak Archive |
© 2005-2022 http://www.MarketOracle.co.uk - The Market Oracle is a FREE Daily Financial Markets Analysis & Forecasting online publication.