Producer Price Inflation Biggest Drop On Record
Economics / Inflation Nov 18, 2008 - 04:43 PM GMTBy: Mike_Shedlock

 Bloomberg is reporting Producer Prices Fall Most on Record .
Yields on 10-year notes touched the lowest in more than three weeks as a slumping economy raised the specter of deflation. Oil reached a 22-month low. China surpassed Japan as the largest foreign holder of Treasuries, easing concern that global investors will stop buying U.S. debt as the government funds a record budget deficit.
The larger-than-forecast 2.8 percent drop in producer prices was the biggest since records began in 1947 and followed a 0.4 percent decline in September, the Labor Department said today in Washington. The median projection in a Bloomberg News survey was for a 1.9 percent fall.
Consumer prices likely dropped 0.8 percent, the most since 1949, according to another Bloomberg survey. The report is scheduled to be released tomorrow.
Net purchases of U.S. bonds, notes and stocks rose to $66.2 billion in September, from a revised $21 billion the month before, the Treasury Department said today. China bought $43.6 billion of Treasuries in the month, replacing Japan as the largest foreign holder of U.S. debt. Japanese investors sold $12.8 billion.
"This is the tail end of what has been a global savings glut," said George Goncalves, chief Treasury and agency strategist with Morgan Stanley, another primary dealer. It "came at the expense of U.S. consumers saving less and foreign consumers saving more."
Savings Glut Theory Yet Again
Can we please dispense with "savings glut" theory? There is no savings glut. Printing RMB in China to buy US Treasuries does not constitute "savings".
For more on the "Savings Glut" idea please see
- Bernanke Blames Saving Glut For Housing Bubble
- Global Savings Glut Exposed
- Strange Case of Falling International Reserves Explored
Producer Price Indexes – October 2008
Let's take a look at the official PPI October 2008 Release .
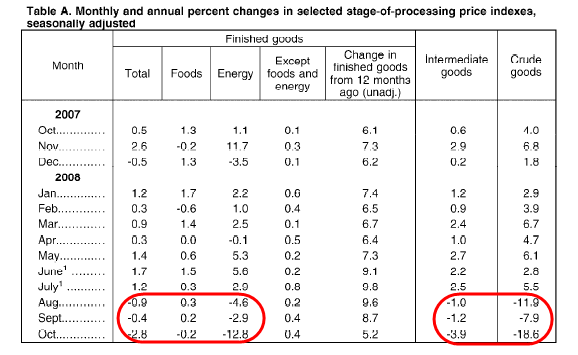
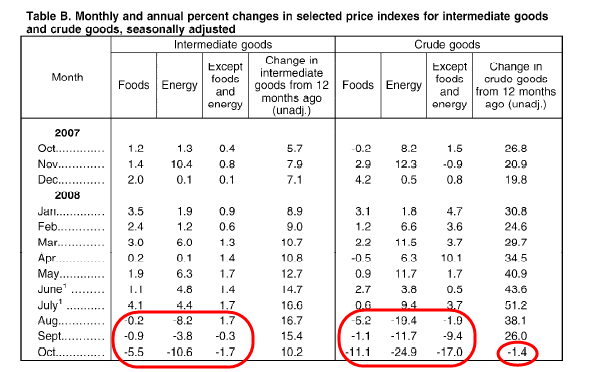
The Producer Price Index for Finished Goods fell 2.8 percent in October, seasonally adjusted, the Bureau of Labor Statistics of the U.S. Department of Labor reported today. This decrease followed a 0.4 percent decline in September and a 0.9-percent fall in August. At the earlier stages of processing, prices received by manufacturers of intermediate goods moved down 3.9 percent in October after declining 1.2 percent in September, and the crude goods index dropped 18.6 percent subsequent to a 7.9-percent decrease in the previous month.
Finished Goods PPI

The overall PPI for finished goods as well as energy have declined three consecutive months. The same holds true for intermediate goods and crude goods.
Intermediate Goods PPI

The key number on the above chart is the year over year decline (the change in crude goods from 12 months ago). Expect to see year over year numbers become increasingly negative as comparisons to prior years become increasingly easy to beat.
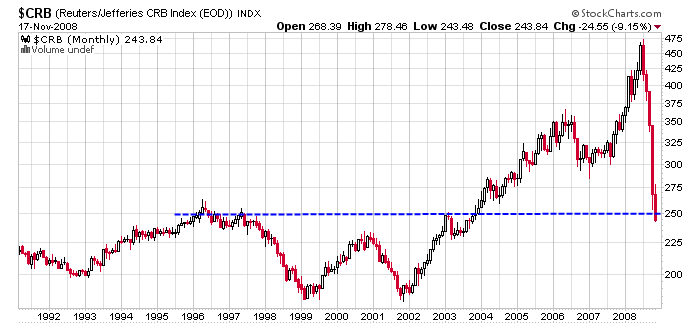
$CRB Commodity Prices Monthly Chart

Commodity prices are now below what they were in January of 2003.
By Mike "Mish" Shedlock
http://globaleconomicanalysis.blogspot.com
Click Here To Scroll Thru My Recent Post List
Mike Shedlock / Mish is a registered investment advisor representative for SitkaPacific Capital Management . Sitka Pacific is an asset management firm whose goal is strong performance and low volatility, regardless of market direction.
Visit Sitka Pacific's Account Management Page to learn more about wealth management and capital preservation strategies of Sitka Pacific.
I do weekly podcasts every Thursday on HoweStreet and a brief 7 minute segment on Saturday on CKNW AM 980 in Vancouver.
When not writing about stocks or the economy I spends a great deal of time on photography and in the garden. I have over 80 magazine and book cover credits. Some of my Wisconsin and gardening images can be seen at MichaelShedlock.com .
© 2008 Mike Shedlock, All Rights Reserved
Mike Shedlock Archive |
© 2005-2022 http://www.MarketOracle.co.uk - The Market Oracle is a FREE Daily Financial Markets Analysis & Forecasting online publication.


