


US Capital Markets Portfolio Composition
Portfolio / Investing Nov 19, 2008 - 01:36 AM GMTBy: Richard_Shaw

 How has the US structured itself in terms of equities and debt instruments, and how large is each component?
The financial news streams us a constant supply of fragmentary numbers about this or that troubled asset category or rescue package. Since they are all in hundreds of billions or even a few trillions of Dollars, it's hard to get a handle on the relative significance of the numbers.
This article provides the comprehensive scope of equities and debt instruments in the United States. That can serve as a sort of yardstick to gauge the relative size of other numbers that are tossed around.
According to the September research report from the SIFMA (Securities Industry and Financial Markets Association), as of June 2008, the US capital structure was:
- Equities 40.6% (proxy VTI)
- Money Markets 8.2%
- Municipal Bonds 5.2% (proxy MUB)
- Other Bonds 46% (proxy AGG).
“Other Bonds” consists of bonds issued by the Treasury, federal agencies, and corporations, as well as mortgage-backed and other asset-backed bonds. That definition corresponds to the Lehman Aggregate Bond index (all bonds over 12-month maturity, and excluding muni bonds).
The image below from SIFMA breaks it all down.
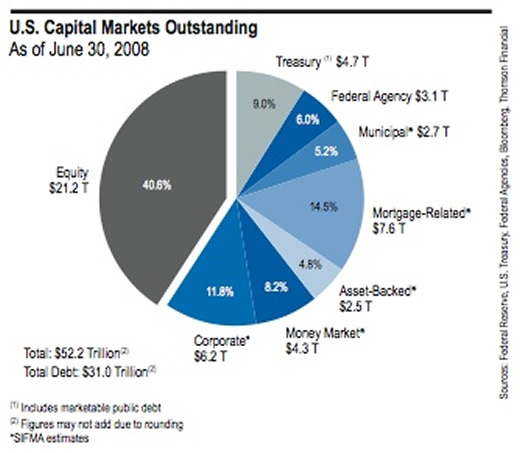
The total capital value of stocks and bonds in the US, according to SIFMA, was $52.2 Trillion, including $31.0 Trillion (59.4%) of debt instruments.
Other Non-Security Assets:
There are, of course, other major non-security assets not represented in the capital markets pie chart. Among the most important are bank savings deposits, equity in real estate (not accounted for in REITs), mortgages and other debts not in mortgage-backed or other asset-backed securities, and the equity in privately owned businesses.
One-Year Ago:
As of September 2007, the capital structure of the US was:
- Equities 43.3%
- Money Markets 7.0%
- Municipal Bonds 5.1%
- Other Bonds 44.6%.
Equities have declined in weight since last September, municipal bonds have remained essentially the same weight, while aggregate bonds and money market funds increased in weight. That represents a combination of movement away from risk and a reduction in value of equities.
The Bailout Package:
Various accounts put the authorized bailout at as much as $2 Trillion to $3 Trillion. That would be equal to about 6% to 10% of the debt instruments in the US, or 4% to 6% of total equity and debt capital.
Derivatives:
We will be looking for some comprehensive numbers for derivatives (as we suspect the Treasury is too) and will relate what we find back to the equity and debt capital cited in this article.
Gross Domestic Product:
The most recent GDP reported by the Bureau of Economic Analysis is $14.4 Trillion, or about 30% of the equity and debt capital, or about 50% of the debt capital of the US.
Composite of Investors in the United States:
The world at large — domestic and foreign investors; individual and institutional investors — appear to hold or to have recently held an approximate portfolio of US assets in round numbers as follows:
- Equities 41% to 43%
- Money Markets 7% to 8%
- Municipal Bonds 5%
- All Other Bonds 45% to 46%%
Because of the damage done to the stock market since June, the average US portfolio will undoubtedly be higher in bonds and lower in equities, and perhaps higher in money markets.
That's not a recommendation to you, but it is potentially helpful to know how everybody else is playing the game.
By Richard Shaw
http://www.qvmgroup.com
Richard Shaw leads the QVM team as President of QVM Group. Richard has extensive investment industry experience including serving on the board of directors of two large investment management companies, including Aberdeen Asset Management (listed London Stock Exchange) and as a charter investor and director of Lending Tree ( download short professional profile ). He provides portfolio design and management services to individual and corporate clients. He also edits the QVM investment blog. His writings are generally republished by SeekingAlpha and Reuters and are linked to sites such as Kiplinger and Yahoo Finance and other sites. He is a 1970 graduate of Dartmouth College.
Copyright 2006-2008 by QVM Group LLC All rights reserved.
Disclaimer: The above is a matter of opinion and is not intended as investment advice. Information and analysis above are derived from sources and utilizing methods believed reliable, but we cannot accept responsibility for any trading losses you may incur as a result of this analysis. Do your own due diligence.
Richard Shaw Archive |
© 2005-2022 http://www.MarketOracle.co.uk - The Market Oracle is a FREE Daily Financial Markets Analysis & Forecasting online publication.