


Does this Stock Market Rally Have Legs?
Stock-Markets / Stocks Bear Market Nov 25, 2008 - 11:10 AM GMT

 Global stock markets rallied for a second consecutive day after the US government agreed to rescue the beleaguered Citigroup (C) and as President-elect Obama introduced his administration's new economic team, emphasizing the need for quick action to hasten an economic recovery and signaling that he may be willing to keep at bay higher taxes for the wealthy.
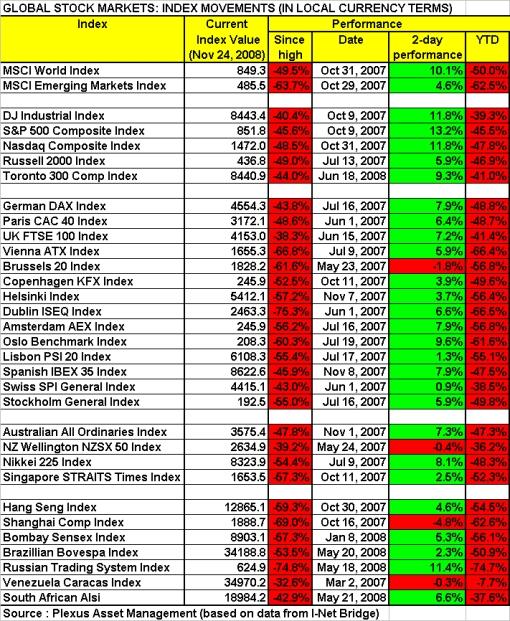
The MSCI Word Index has improved by 10.1% since the start of trading last Friday, whereas the MSCI Emerging Markets Index lagged somewhat and registered a more modest gain of 4.6%.
The table below shows the performances of various global stock markets over the past two trading days, as well as figures since the respective markets' highs and for the year to date (all in local currency terms).
The Dow Jones Industrial Index rose by 11.8% on Friday and Monday – only the 13th time since 1896 that the Index has had a two-day winning streak with a gain of more than 10%, according to Bespoke . “In prior occurrences when the Dow had one of these rallies following long periods of declines (-30% over 200 trading days), the average returns were notably more positive. While the next day had typically been negative, over the next week and month the average returns improved significantly.”
One must be careful not to attach too much value to one- or two-day movements, but should also be cognizant of the fact that stock markets bounced off multi-year chart support levels near the 2002 lows.
I said the following in my “Words from the Wise” review on Sunday: “Oversold conditions are bound to result in rallies from time to time (and possibly around Thanksgiving), but these should not be trusted at face value. For a more lasting market turnaround to happen, I would like to see evidence of base formations on the charts, a 90% up-day , and relative outperformance by the financial sector.”
At the time of writing, no confirmation had been received on whether yesterday was a 90% up-day, but the market's volume and breadth indicators were certainly was not too shabby. Although the past two days' outperformance of financials (Financial SPDR +18.7%) and banks (Philadelphia Bank Index +18.3%) is encouraging, it is too early to mark a new trend as far as relative performance is concerned.
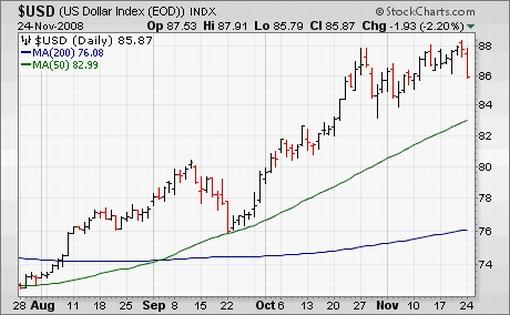
I also alerted readers on Sunday that I was “closely monitoring the surges in the US dollar and Japanese yen – low-yielding currencies previously used for funding risky investments – as a break of the uptrends in these two currencies will be a good indicator of the forced deleveraging selling starting to subside. Once this situation has played itself out, we should see a return to lower volatility levels and a return of confidence.”
It is on this front that yesterday's news was quite encouraging. Both the US dollar and the Japanese yen lost grounds. As a matter of fact, the trade-weighted US Dollar Index (-2.2%) experienced its worst day since 1985, and its 5th worst day since 1970.
Adding more credence to the bounce in stock markets is the fact that consistency occurred across asset classes as oversold commodities rallied (Reuters/Jeffries CRB Index +5.4%, West Texas Intermediate crude +9.2%, and gold bullion +3.6%) and overbought bonds corrected (+17 basis points in the case of the ten-year US Treasury Note yield).
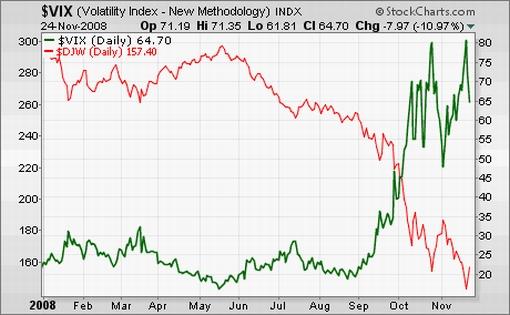
Also consistent with the fact that investors have gained somewhat more confidence in risky assets, is the 20% decline in the CBOE Volatility Index (VIX) over the past two trading days. The VIX is strongly inversely correlated to the movements in stock markets, using the Dow Jones World Index as an example in the graph below.
A final positive for the bulls is that the period post Thanksgiving through the end of the year has usually been a strong time for stocks. Also, according to Jeffrey Hirsch ( Stock Trader's Almanac ), “December is normally a banner month for stocks, ranking second [on the monthly calendar] for the Dow and S&P 500 and third for the Nasdaq.”
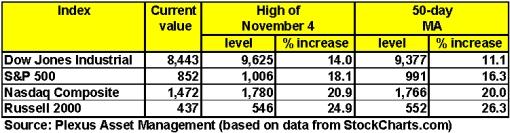
Should the bullish seasonal tendencies hold true on this occasion, the next question is what the magnitude of the potential rally might be. The table below shows the November 4 highs and 50-day moving average levels for the major US indices, together with the increases that will be required to reach these levels. Although this is guesswork, these levels could be initial rally targets.
I remain wary of rallies as the primary trend of the market is still bearish and it may not be out of the woods yet. A reminder of the ugly economic reality can again show when poor earnings numbers are announced by the start of the next reporting season in mid-January. In the meantime, enjoy whatever further upside the rally may have in store.
Did you enjoy this post? If so, click here to subscribe to updates to Investment Postcards from Cape Town by e-mail.
By Dr Prieur du Plessis
Dr Prieur du Plessis is an investment professional with 25 years' experience in investment research and portfolio management.
More than 1200 of his articles on investment-related topics have been published in various regular newspaper, journal and Internet columns (including his blog, Investment Postcards from Cape Town : www.investmentpostcards.com ). He has also published a book, Financial Basics: Investment.
Prieur is chairman and principal shareholder of South African-based Plexus Asset Management , which he founded in 1995. The group conducts investment management, investment consulting, private equity and real estate activities in South Africa and other African countries.
Plexus is the South African partner of John Mauldin , Dallas-based author of the popular Thoughts from the Frontline newsletter, and also has an exclusive licensing agreement with California-based Research Affiliates for managing and distributing its enhanced Fundamental Index™ methodology in the Pan-African area.
Prieur is 53 years old and live with his wife, television producer and presenter Isabel Verwey, and two children in Cape Town , South Africa . His leisure activities include long-distance running, traveling, reading and motor-cycling.
Copyright © 2008 by Prieur du Plessis - All rights reserved.
Disclaimer: The above is a matter of opinion and is not intended as investment advice. Information and analysis above are derived from sources and utilizing methods believed reliable, but we cannot accept responsibility for any trading losses you may incur as a result of this analysis. Do your own due diligence.
Prieur du Plessis Archive |
© 2005-2022 http://www.MarketOracle.co.uk - The Market Oracle is a FREE Daily Financial Markets Analysis & Forecasting online publication.