


Stocks Bear Market Rally Continues During December
Stock-Markets / US Stock Markets Dec 01, 2008 - 08:29 AM GMTBy: Andre_Gratian

 Current Position of the Market
SPX: Long-term trend -
Down! The very-long-term cycles have taken over earlier than anticipated and if they make their lows when expected, the bear market which started in October 2007 should continue until 2012- 2014.
SPX: Intermediate trend - intermediate low may have been reached in November, but this remains to be confirmed. There is good possibility that January 2009 will bring a new low, or at least a test of the lows.
Analysis of the short-term trend is done on a daily basis with the help of hourly charts. It is an important adjunct to the analysis of daily and weekly charts which determines the course of longer market trends.
Daily market analysis of the short term trend is reserved for subscribers. If you would like to sign up for a FREE 4-week trial period of daily comments, please let me know at ajg@cybertrails.com .
Overview:
As previously implied, November did, indeed, see all indices make new bear market lows with the SPX and OEX briefly going below their 2002 lows. For some Elliott Wave analysts, this represents the end of intermediate wave 3 and should bring an up-move of intermediate proportions which is now underway. For others wave 3 is not yet complete and new lows are needed. Others still are seeing an entirely different pattern. (So, what's new?)
Combined positive divergence in the momentum indicators and an oversold A/D oscillator, as well as shortterm cycles pointed to a low on 11/21. Since then, the SPX has moved up 150+ points (one of its best rallies since the October lows) and has the potential of going even higher after a short correction. How high? It depends on which of the EW interpretations is correct. Both daily momentum and A/D oscillators are getting overbought, and a sharp drop in the volume as the rally progressed suggests that it is on borrowed time and getting ready for a phase of consolidation which may be followed by higher prices.
We'll examine all of the technical indications in more detail in the following sections under "what's ahead?".
The stock market is a barometer for the economy. Both were holding relatively well until May of this year, then the stock market started to go into a tailspin, and now the economy is following. Next year is likely to be very weak, economically, and it may be a while before the trillions of dollars in economic rescue and stimulus packages have an impact. Has the stock market discounted enough for now? And for how long will the 2002 and 2003 lows hold? We'll need to see more than one week of rallying before we can decide that a good low is in place.
What's ahead?
Chart pattern and momentum:
In the last Newsletter, looking at the weekly chart I stated:
This is not the chart of an index which has made a low. At the very least, it will have to break out of the brown channel before we can say that a temporary low is in place.
The indicators are confirming this. The MACD (on top) is still heading down with no real sign of deceleration, and the momentum indicator (below) has only bounced up due to an extreme oversold condition.
Two weeks later, there has been improvement. First of all, the SPX dropped all the way to the bottom of its projection zone (vertical pink line) where it found support on two separate bottom channel lines.
As it did so and re-bounded, it created some positive divergence in the bottom oscillator. Of course, we could not tell how much it would be until this week's close, since end-of-the-week readings are used to create the index. With another week of good rallying, the divergence has turned out to be very strong.
Note, also, how the indicator is challenging the top channel lines of two channels -- one going back as far as October 2006. It suggests that there is more rallying to do if the channel lines are decisively penetrated.

At the low which occurred on 11/21, the daily chart showed strong positive divergence in the top (momentum) oscillator and much less -- but still some in the bottom (breadth) indicator which was oversold. Divergence, support from the main down channel lower line, and the bottoming of two minor cycles assured some sort of a rally. This rally has now overcome a minor trend line and is working its way through a more important trend line which goes back to the high of September 19th.
The indicators are getting overbought and have not had corrections since their low. These and other technical conditions which will be better seen on the hourly chart, are telling us that we are due for a consolidation. Afterwards, the rally is likely to continue to a higher level: perhaps to where the two dotted lines and the solid line across the two former short-term peaks converge and should provide resistance. An extension of the rally to about 950 or so would probably bring the indicators to a sell position from which a challenge of the lows, or even a new low, would take place. A projection for the rally top will be made after we have had a consolidation.
The hourly chart gives us reasons to expect an imminent pull-back in the SPX. The momentum oscillator is overbought, and even though it has not yet turned down, it's probably only a matter of hours before it does, especially with the A/D oscillator showing negative divergence on Friday. This does not mean that we cannot go higher in a final spurt on Monday. We did close on our highs on Friday and outside of the downtrend line.
So we could go a little farther, especially with Barack Obama scheduled to hold another press conference. But any advance from here would have difficulty being sustained. The blue asterisk which you see on the right is when a minor cycle is expected to make its low, but the correction could even run into early the following week.
Cycles
It's possible that November 21st finally saw the low of the 6-year cycle, but I will let time decide that. If it has, it's possible that that date will turn out to be an intermediate-term low. It also looks as if that was the 10-wk cycle low.
I believe that the 9-mo cycle low is still ahead of us and will turn out to be a little past mid-December.
A minor cycle is due on 12/3.
Projections:
The rally has gone past a short-term projection of about 882 which would have corresponded with the trend line discussed above. Because of this obvious strength, it is possible that we will go and challenge the previous peak of 917 before turning down.
I will not be able to estimate the top of the entire rally until we have had a correction.
Breadth
The configuration of the McClellan Summation Index (courtesy of StockCharts) and of its MACD and RSI is giving us reasons to think that it could have made a much more important low on 11/21 than any of its previous ones this year. For the first time, the index and its indicators are trying to establish an uptrend after making a higher low while the SPX moved lower (positive divergence). It's still very fragile, but it's a start and could develop into a more solid pattern as we go forward.
The next few days, however, will be critical because the daily A/D oscillator is becoming overbought and suggests that we are near a correction.
A nearby correction is also validated by the hourly pattern which gave us negative divergence vs. price on Friday. Unless we have a strong opening, the correction could start as early as Monday morning.
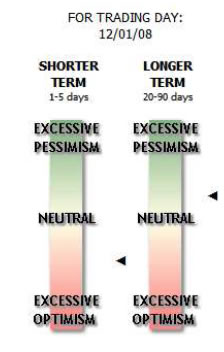
Market Leaders and Sentiment
The sentiment indicator (courtesy Sentiment Trader) is forecasting the imminence of a short-term top. As you can see below, the short-term index has moved into the red, suggesting that the market is overbought shortterm and at risk of pulling-back. This also confirms what other indicators discussed above are saying.
The longer term is still OK, suggesting that after a short correction, the rally could be extended.
Summary
This bear market rally looks as if it has longer to go, but not before a short-term correction which could come as early as Monday/Tuesday.
The following are examples of unsolicited subscriber comments:
What is most impressive about your service is that you provide constant communication with your subscribers. I would highly recommend your service to traders. D.A.
Andre, you did it again! Like reading the book before watching the movie. B.F.
I would like to thank you so much for all your updates/newsletters. As I am mostly a short-term trader, your work has been so helpful to me as I know exactly when to get in and out of positions. I am so glad I decided to subscribe to Turning Points… Please rest assured that I shall continue to be with Turning Points for a long time to come. Thanks once again! D.P.
But don't take their word for it! Find out for yourself with a FREE 4-week trial. Send an email to ajg@cybertrails.com .
By Andre Gratian
MarketTurningPoints.com
A market advisory service should be evaluated on the basis of its forecasting accuracy and cost. At $25.00 per month, this service is probably the best all-around value. Two areas of analysis that are unmatched anywhere else -- cycles (from 2.5-wk to 18-years and longer) and accurate, coordinated Point & Figure and Fibonacci projections -- are combined with other methodologies to bring you weekly reports and frequent daily updates.
“By the Law of Periodical Repetition, everything which has happened once must happen again, and again, and again -- and not capriciously, but at regular periods, and each thing in its own period, not another’s, and each obeying its own law … The same Nature which delights in periodical repetition in the sky is the Nature which orders the affairs of the earth. Let us not underrate the value of that hint.” -- Mark Twain
You may also want to visit the Market Turning Points website to familiarize yourself with my philosophy and strategy.www.marketurningpoints.com
Disclaimer - The above comments about the financial markets are based purely on what I consider to be sound technical analysis principles uncompromised by fundamental considerations. They represent my own opinion and are not meant to be construed as trading or investment advice, but are offered as an analytical point of view which might be of interest to those who follow stock market cycles and technical analysis.
Andre Gratian Archive |
© 2005-2022 http://www.MarketOracle.co.uk - The Market Oracle is a FREE Daily Financial Markets Analysis & Forecasting online publication.