


U.S. Stock Market Valuations and Returns, What's Next?
Stock-Markets / Stock Market Valuations Dec 03, 2008 - 11:59 AM GMT

 Stock market movements over the past few months have been characterized by increased volatility as uncertainty became paramount. And as new pieces of the economics puzzle are added every day, investors are increasingly grappling to make sense of the most likely direction of stock prices.
It seems to be a case of so many pundits, so many views. Has the market started bottoming out, or are bourses still in the grip of the bear? Or is a “muddle-through” trading range in store?
It is one thing to trade the market's rallies and corrections, but this is easier said than done, with not many people actually getting it right with any degree of consistency. Others are of the opinion that the recipe for creating wealth is simply to follow the patient approach, saying that “it's time in the market, not timing the market” that counts.
This gives rise to the all-important question: does one's entry level into the market, i.e. the valuation of the market at the time of investing, make a significant difference to subsequent investment returns?
In an attempt to cast light on this issue, my colleagues at Plexus Asset Management have updated a previous multi-year comparison of the price-earnings (PE) ratios of the S&P 500 Index (as a measure of stock valuations) and the forward real returns. The study covered the period from 1871 to October 2008 and used the S&P 500 (and its predecessors prior to 1957). In essence, PEs based on rolling average ten-year earnings were calculated and used together with ten-year forward real returns.
In the first analysis the PEs and the corresponding ten-year forward real returns were grouped in five quintiles (i.e. 20% intervals) (Diagram A.1).
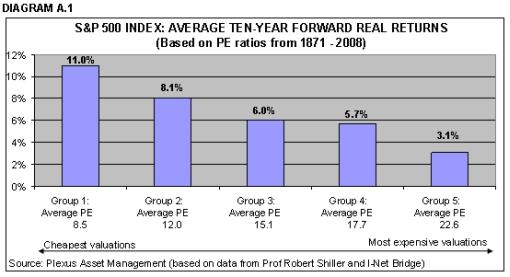
The cheapest quintile had an average PE of 8.5 with an average ten-year forward real return of 11,0% per annum, whereas the most expensive quintile had an average PE of 22.6 with an average ten-year forward real return of only 3.1% per annum.
This analysis clearly shows the strong long-term relationship between real returns and the level of valuation at which the investment was made.
The study was then repeated with the PEs divided into smaller groups, i.e. deciles or 10% intervals (see Diagrams A.2 and A.3).
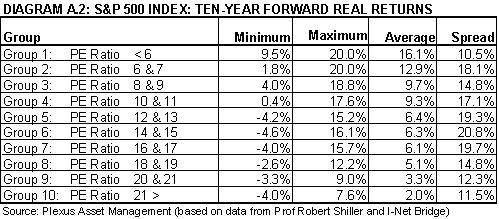
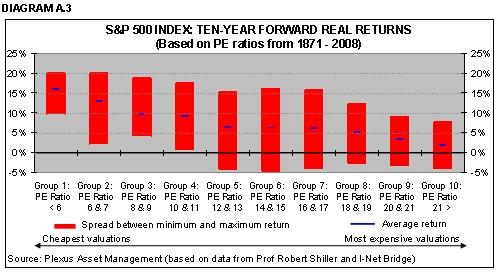
This analysis strongly confirms the downward trend of the average ten-year forward real returns from the cheapest grouping (PEs of less than six) to the most expensive grouping (PEs of more than 21). The second study also shows that any investment at PEs of less than 12 always had positive ten-year real returns, while investments at PE ratios of 12 and higher experienced negative real returns at some stage.
A third observation from this analysis is, interestingly, that the ten-year forward real returns of investments made at PEs between 12 and 17 had the biggest spread between minimum and maximum returns and were therefore more volatile and less predictable. Interestingly, given that the current 10-year normalized PE of 14.9 falls in the middle of this range, the exceptional volatility being experienced at the moment is consistent with historical patterns.
As a further refinement, holding periods of one, three, five and 20 years were also analyzed. The research results (not reported in this article) for the one-year period showed a poor relationship with expected returns, but the findings for all the other periods were consistent with the findings for the ten-year periods.
Although the above analysis represents an update to and extension of an earlier study by Jeremy Grantham's GMO, it was also considered appropriate to replicate the study using dividend yields rather than PEs as valuation yardstick. The results are reported in Diagrams B.1, B.2 and B.3 and, as can be expected, are very similar to those based on PEs.
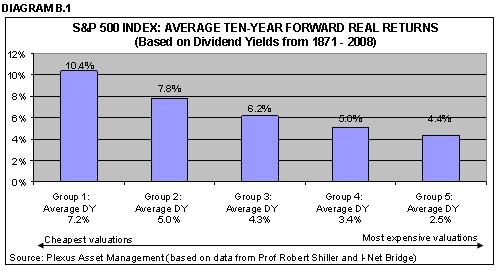
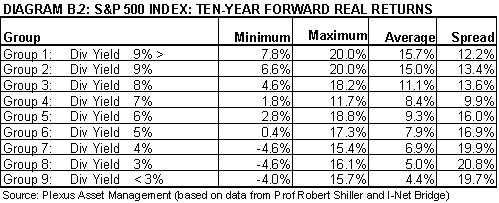
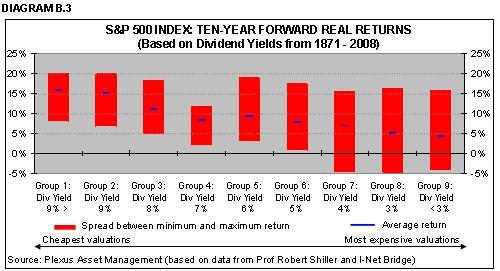
Based on the above research findings, with the S&P 500 Index's current ten-year normalized PE of 14.9 and ten-year normalized dividend yield of 3.1%, investors should be aware of the fact that the market is by historical standards still only in “average value” territory. As far as the market in general is concerned, this argues for unexciting long-term returns, possibly a “muddle-through” trading range for a number of years to come.
Although the research results offer no guidance as to calling market tops and bottoms, they do indicate that it would not be consistent with the findings to bank on above-average returns based on the current ten-year normalized valuation levels. As a matter of fact, there is a distinct possibility of some negative returns.
Did you enjoy this post? If so, click here to subscribe to updates to Investment Postcards from Cape Town by e-mail.
By Dr Prieur du Plessis
Dr Prieur du Plessis is an investment professional with 25 years' experience in investment research and portfolio management.
More than 1200 of his articles on investment-related topics have been published in various regular newspaper, journal and Internet columns (including his blog, Investment Postcards from Cape Town : www.investmentpostcards.com ). He has also published a book, Financial Basics: Investment.
Prieur is chairman and principal shareholder of South African-based Plexus Asset Management , which he founded in 1995. The group conducts investment management, investment consulting, private equity and real estate activities in South Africa and other African countries.
Plexus is the South African partner of John Mauldin , Dallas-based author of the popular Thoughts from the Frontline newsletter, and also has an exclusive licensing agreement with California-based Research Affiliates for managing and distributing its enhanced Fundamental Index™ methodology in the Pan-African area.
Prieur is 53 years old and live with his wife, television producer and presenter Isabel Verwey, and two children in Cape Town , South Africa . His leisure activities include long-distance running, traveling, reading and motor-cycling.
Copyright © 2008 by Prieur du Plessis - All rights reserved.
Disclaimer: The above is a matter of opinion and is not intended as investment advice. Information and analysis above are derived from sources and utilizing methods believed reliable, but we cannot accept responsibility for any trading losses you may incur as a result of this analysis. Do your own due diligence.
Prieur du Plessis Archive |
© 2005-2022 http://www.MarketOracle.co.uk - The Market Oracle is a FREE Daily Financial Markets Analysis & Forecasting online publication.