Crude Oil Closing in on $40
Commodities / Crude Oil Dec 05, 2008 - 01:00 PM GMTBy: Mike_Paulenoff
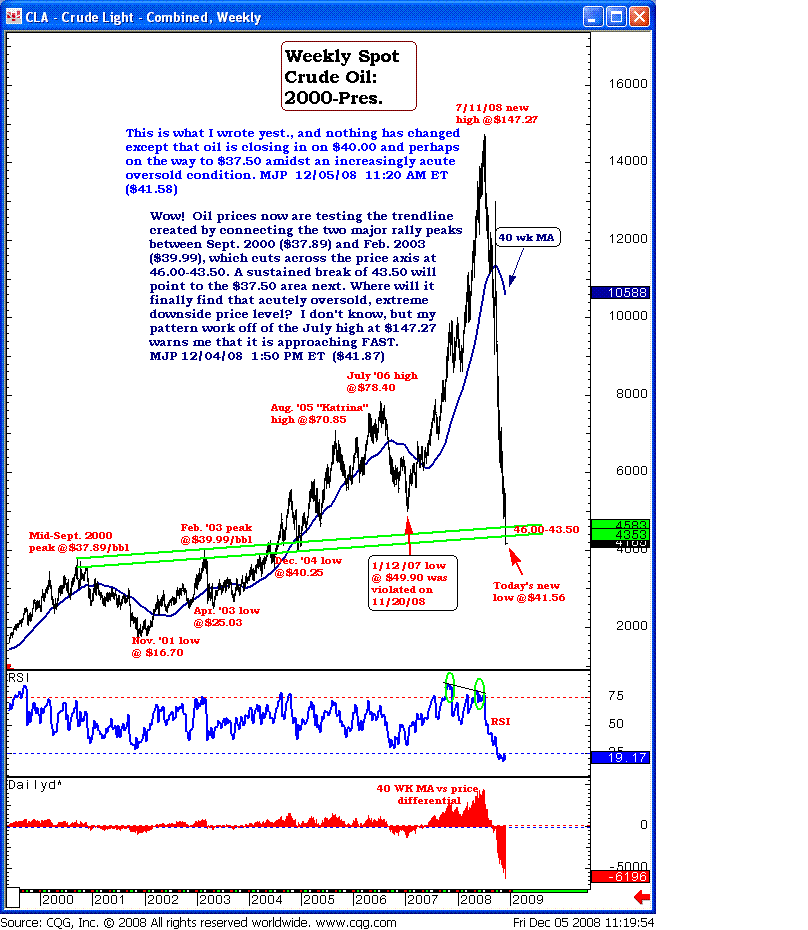
 Oil is closing in on $40.00 and perhaps on the way to $37.50 amidst an increasingly acute oversold condition. The trendline created by connecting the two major rally peaks between September 2000 ($37.89) and February 2003 ($39.99) cuts across the price axis at 46.00-43.50.
As the chart shows, a sustained break of 43.50 points to the $37.50 area next. Where will it finally find that acutely oversold, extreme downside price level? I don't know, but my pattern work off of the July high at $147.27 warns that it is approaching fast, a potential opportunity for ETF traders of the US Oil Fund (AMEX: USO).

Sign up for a free 15-day trial to Mike's ETF Trading Diary today.
By Mike Paulenoff
Mike Paulenoff is author of the MPTrader.com (www.mptrader.com) , a real-time diary of Mike Paulenoff's trading ideas and technical chart analysis of Exchange Traded Funds (ETFs) that track equity indices, metals, energy commodities, currencies, Treasuries, and other markets. It is for traders with a 3-30 day time horizon, who use the service for guidance on both specific trades as well as general market direction
© 2002-2008 MPTrader.com, an AdviceTrade publication. All rights reserved. Any publication, distribution, retransmission or reproduction of information or data contained on this Web site without written consent from MPTrader is prohibited. See our disclaimer.
Mike Paulenoff Archive |
© 2005-2022 http://www.MarketOracle.co.uk - The Market Oracle is a FREE Daily Financial Markets Analysis & Forecasting online publication.


