


Weekly Gold and Silver Technical Analysis Report - Technically Precious with Merv
Commodities / Gold & Silver Apr 15, 2007 - 09:25 PM GMTBy: Merv_Burak

A couple of ups and downs during the week but mostly ups. Are we heading for new highs ahead?
GOLD : LONG TERM
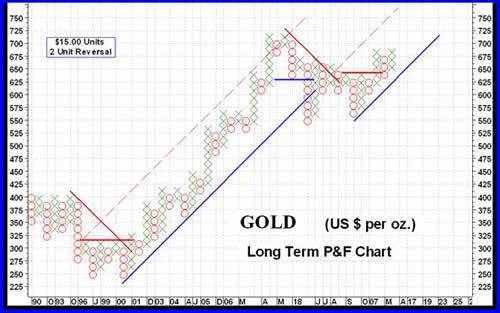
After a bit of a bummer during 2006 the long term P&F chart is once more starting to give the impression of good things to come. The projection for this move, at the initial break-out, was to the $780 level and now with the subsequent move we have a further projection to $915 ($970 if I use a $10 unit, 3 unit reversal chart). There are hurdles along the way, such as the previous 2006 high at $720 but we'll take them as they come. For now we should be smiling that things are looking better than they have for some time now. The projections suggest new ALL TIME HIGHS ahead for gold. Now let's keep our fingers crossed that we do not get any serious surprises to ruin the scenario. Let's see what the daily long term candlestick chart has to say.
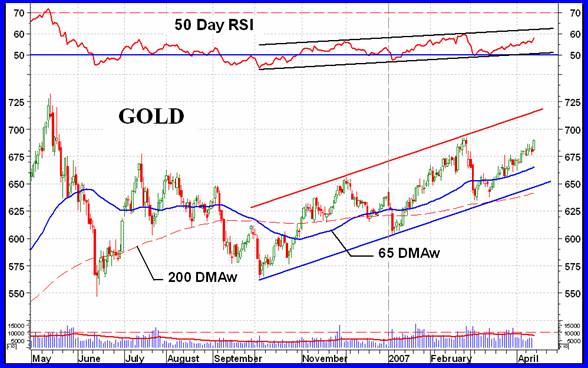
Probably the most important basic indicator is the trend one, using the moving average. The recent price action continues above a positive sloping long term moving average line for a bullish trend indication. The action has remained inside that up trending channel previously shown (see intermediate term chart). The trend of the action remains towards the upper resistance trend line but it is still some distance away for the resistance. As for the price momentum (or strength), well that is still a question mark. Although the long term momentum indicator remains in the positive zone it has not yet shown any real strength in the resent price activity. The momentum indicator remains in a lateral trend more so than in an upward trend. There has been very little vertical % moves in this indicator for about 10 months now. I'm looking forward to some new strength here but remain a little cautious until such strength makes itself known. As for volume, well the cumulative volume indicator, the On-Balance Volume (OBV), is at new highs for a very positive indication. However, looking at the daily action versus the average volume over a long term period, the recent volume activity has been below the average for a cautionary reading. During most of last year the long term average of the daily volume activity has been in a downward trend. However, since the beginning of this year that changed and the long term average of daily activity has been rising. Even though the daily activity over the past week or so has been below the long term average this average is still in a rising mode so we might expect the volume to start perking up again any day.
All in all I am back to the BULLISH perspective on the long term.
INTERMEDIATE TERM
The intermediate term P&F chart is in a bullish mode. Another couple of $ on the up side and this chart will be into new highs since the start of the down trend last May. Other than that, I am inclined not to try and get too much information from the intermediate term P&F at this time. There are times that the P&F chart is just not providing much information due to the congestion in the chart and this is one of those times. So, let's go to the normal indicators.
As the chart above shows, the recent action has been above the intermediate term moving average line and the line is comfortably sloping upwards. The action remains inside the channel but this channel has been active for over 6 months and is more logically a long term channel and is commented upon in that section. We still need a little more upside price action to get into new recovery highs but that should come in the next few days, hopefully.
As for momentum, that action also remains inside its upward trending channel and above the neutral line. The indicator is still not very strong and would require greater upside moves to improve strength and the prospect of longevity for the recent trend. The OBV, as mentioned earlier, is at new highs so there is not much to say about it. Let's look at the daily volume action on the lower portion of the chart. The solid red line is an intermediate term daily volume average line. This moving average line is not very volatile BUT has taken a sharp downward turn very recently. The daily action remains below this line indicating lack of speculative interest recently versus the speculative interest over the intermediate term period. Friday may have changed this but I do not have the Friday volume numbers. Looking at past activity this volume average line usually turns down AFTER a down turn in price has started. Here, we have a down turn in the volume average line while the price action is still to the up side. Maybe it's telling us to be prepared for a down turn in the price action. It's best to look at this as a warning sign and to be prepared, but in the mean time go with the positive trend in motion.
I guess it's time to get off the neutral fence and get back into the BULLISH side based upon the intermediate term indicators.
SHORT TERM
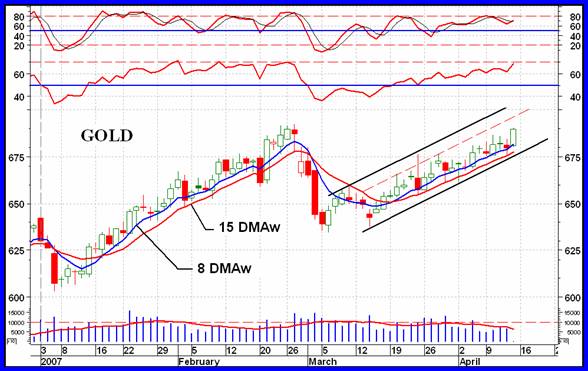
So, where are we from the short term perspective? The chart shows a continuous up trend within a well defined channel. This action has been going on for 5 weeks now and cannot continue for ever, but when will it reverse? For now the action remains above a positive short term moving average line (15 DMAw) and the moving average line is still sloping upwards. Momentum is confirming this positive action and is, in fact, almost ready to enter its over bought zone. Will this be similar to what happened during the last week of January with continued upside price action or will it be like the end of February with a down side move in price? I think we still have more upside left in this move so would not be inclined to bail out yet, but would be on guard. Should the price drop below the lower channel trend line and the moving average turn downward, that would be a sign of a short term reversal movement in progress. Until then, I remain positive as far as the continued price trend is concerned.
Looking at that daily volume action, once more it is giving us some concern. The solid red line here is a short term volume action line. Since early March the trend of this line has been to the down side. This happened in late January and the price continued for another month. The same might happen here. One just does not like to see volume activity diminishing as the price moves higher. This, too often, is a warning of a reversal ahead. However, a trend in motion remains in motion until verified otherwise so stay on the up side until the reversal is noted.
IMMEDIATE TERM
The flip of the coin suggests that we still have another day or two of positive trend ahead. However, watch that $675 level for an indication of immediate term trend change.
NORTH AMERICAN GOLD INDICES
Today we are once more looking at the AMEX Gold Miners Index as our major North American Index.
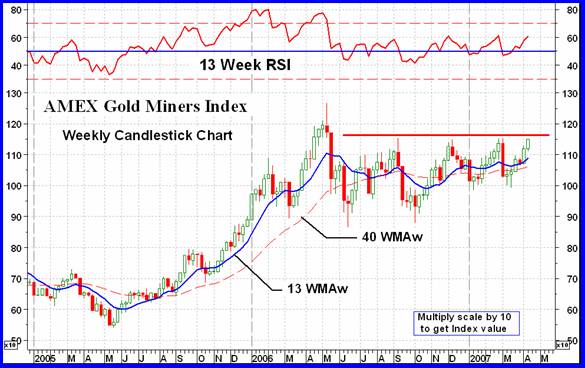
All four of the major North American Gold Indices have the same problem. None of them have yet reached into new highs. The chart of the AMEX Gold Miners Index is a good representation of the majors. Here we see that the Index has not been able to exceed the initial rally high after the May 2006 decline. This has set up a strong resistance level that continues to hold. By contrast ALL of the Merv's Precious Metals Indices have reached new all time highs. The Merv's Gamb-Gold Index is now 22.4 % ABOVE the May 2006 high and moving higher.
It is looking like the Index wants to move higher and into new highs. This may actually happen over the next few weeks but let's not get too far ahead of ourselves. First is to break through that resistance level.
MERV'S PRECIOUS METALS INDICES
It was another good week for the various Merv's Indices. They all advanced on the week with gains from 2.0% to 4.8%. ALL of the Indices have now exceeded their previous May 2006 highs and all but the Spec-Silver Index have moved into new all time highs. The Spec-Silver Index made new all time highs a month ago and is only a fraction of a % from once again making it into new all time highs. As noted above, the Merv's Gamb-Gold Index is now 22.4% ABOVE its May 2006 high.
The Merv's Composite Index of Precious Metals Indices has now just inched into new all time highs, exceeding its May 2006 high. Since all of the other Indices in this Composite, other than the Merv's Indices, are still below their May 2006 highs the action of the Merv's Indices must be the driving force behind this move in the Composite.
Looking at the Precious Metals Indices Table, all of the Indices (except for the US $ Index which moves counter to gold) are now rated as POS for all three time periods. The only other deviation is the long term rating for S&P/TSX Global Gold Index, which is still at + N. This should change next week.
MERV'S GOLD & SILVER 160 INDEX
This is the most important Index to watch as it tells us what the overall universe of 160 gold stocks is doing. This universe includes every stock that is a component stock of the four major North American Indices and also includes the top 100 North American traded stocks in market value. It is not just a speculative Index although there are a goodly number of speculative or gambling types of stocks included. This Index is about as good of an Index as you will find to understand what's happening in the overall universe of precious metals stocks. To understand what specific sectors of this universe are doing we go to the three Sector Indices (see below) or the Silver Indices.
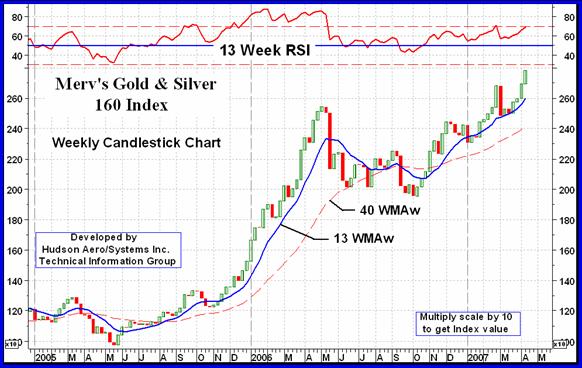
The average stock in this universe gained 3.3% during the week. We had 69% of the component stocks advancing during the week and 29% declining. When summing up the individual stock ratings in the various investment time periods we get 73% BULLISH for the short term, 68% BULLISH for the intermediate term and 69% BULLISH for the long term.
As for the technical indicators, all is positive. The weekly activity has been above both the intermediate and long term positive moving average lines and the momentum indicators for both periods are positive. Although the momentum indicators might still be a little weak versus the price action this is becoming less and less so.
The final thing I like to look at in the universe is to check how many individual stocks made it into my arbitrary plus/minus 30% weekly move category. This, as an indication of out right speculation. Although we had several stocks with advances in the 20% area there were only two stocks that made it into the over 30% category. Outright speculation has still not made itself felt so that there may still be lots of upside to go from here. Once we start to get more stocks in this category then one might start to suspect a top.
MERV'S QUAL-GOLD INDEX : MERV'S SPEC-GOLD INDEX : MERV'S GAMB-GOLD INDEX
The three sector Indices continue on their merry way into new all time highs. Once again the weekly performance depended upon the “quality” of the Index. The higher the “quality” the lower the weekly performance. The Qual-Gold gained 2.2%, the Spec-Gold gained 3.5% and the bottom of the barrel in “quality”, the Gamb-Gold gained 4.8%. Just the opposite was evident in the number of component stocks gaining during the week. The Qual-Gold Index had 87% gaining and 13% losing, the Spec-Gold had 80% gaining and 20% losing. On the low side was the Gamb-Gold Index with only 60% gaining and 40% losing. It is therefore evident that the fewer Gamb-Gold gainers did so at a much higher % gain then did the larger number of Qual-Gold gainers. The action is still in the more speculative (gambling) type of stocks.
As for the technical indicators, what was said for the overall universe of 160 applies here.
SILVER
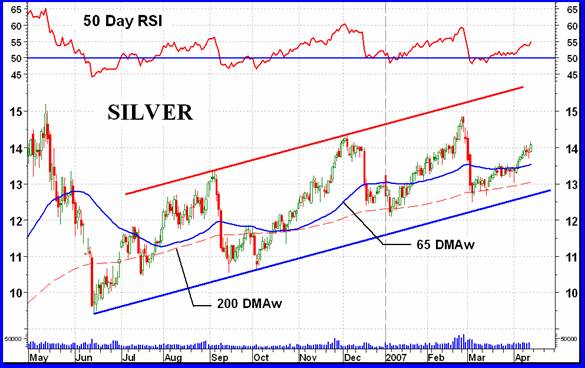
Silver has been trapped inside a wide up trending channel for some 10 months now and there is no sign that it will get out of this channel any time soon. Although at times it seems to perform better than gold (this week's gain of 2.5% versus gold at 1.5%) overall the two metals appear more in concert with each other. Although all the indications are for a BULLISH intermediate and long term there is nothing yet to indicate anything other than a slow progression and not any explosive moves that would get every one's attention.
MERV'S QUAL-GOLD INDEX : MERV'S SPEC-GOLD INDEX
With a few minor variations these two Indices are acting together. Both are above their positive intermediate and long term positive moving average lines and both have their momentum indicators in the positive zone. The Spec-Silver gained a little more on the week than the Qual-Silver, with a 3.3% gain versus a 2.0% gain. For the Qual-Silver 70% of the stocks advanced and 30% declined while for the Spec-Silver the numbers were 64% advancing and 36% declining. All of the summation of individual ratings were BULLISH this week with the Qual at 90% short term, 80% for intermediate and long term. The Spec-Silver had BULLISH ratings of 70% short term, 54% intermediate term and 60% long term.
MERV'S PRECIOUS METALS INDICES TABLE
Well, I'm ready to call it another week.
Merv Burak,
CMTHudson Aero/Systems Inc.
Technical Information Group
for Merv's Precious Metals Central
Web: www.themarkettraders.com
e-mail: merv@themarkettraders.com
During the day Merv practices his engineering profession as a Consulting Aerospace Engineer. Once the sun goes down and night descends upon the earth Merv dons his other hat as a Chartered Market Technician ( CMT ) and tries to decipher what's going on in the securities markets. As an underground surveyor in the gold mines of Canada 's Northwest Territories in his youth, Merv has a soft spot for the gold industry and has developed several Gold Indices reflecting different aspects of the industry. As a basically lazy individual Merv's driving focus is to KEEP IT SIMPLE .
To find out more about Merv's various Gold Indices and component stocks, please visit www.themarkettraders.com and click on Merv's Precious Metals Central . There you will find samples of the Indices and their component stocks plus other publications of interest to gold investors. While at the themarkettraders.com web site please take the time to check out the new Energy Central site for the most comprehensive survey of energy stocks on the internet.Before you invest, Always check your market timing with a Qualified Professional Market Technician
© 2005-2022 http://www.MarketOracle.co.uk - The Market Oracle is a FREE Daily Financial Markets Analysis & Forecasting online publication.