


Stock Market Forecast 2009
Stock-Markets / Investing 2009 Jan 15, 2009 - 01:31 AM GMTBy: Daniel_Smolski

 With the New Year comes the annual tradition of predictions on where the stock market is headed. It has been a long time since I have so much variability in forecasts. Main stream economists have abandoned the usual permabull stance and many are in fact predicting large declines. Most, however, continue with a staunch approach of buy-and-hold in the face of the biggest declines since 2001. Any buy-and-hold investor who purchased after 1997 is now officially sitting in the red.
Buy-and-hold strategy is what virtually all professors will tout to their students as the only viable strategy. The approach is based on the idea that “no one can beat the market” as per the efficient market hypothesis. It argues that because all information has been priced into the stock market, outperforming the index is a matter of luck. It fails to consider that information is only as useful as one utilizes it and interprets it. Every glass of water can be viewed as half-full or half-empty. And we all know the adage that if you fill a room of economists, you will never have them agree on a single issue. It is all simply because information absorption is completely subjective. Every individual has his own experiences and education that help form his or her view and outlook. This education and experience is what separates the average investor from the consistently successful investor.
History is rife with examples of individuals who consistently outperform the indices. The most famous is Warren Buffet who has averaged more than double the return of the S&P the past two decades. His investments are based on an approach of purchasing undervalued companies. The fact that he can do so conveys that there are misallocations of capital in free markets. George Soros, famous for breaking the bank of England, averaged 30% in the three decades with the Quantum Fund. Peter Lynch, Bell Graham, John Templeton, the list is endless of people defying the efficient market hypothesis and challenging the “buy-and-hold” strategy.
Every one of these individuals has an investment strategy that works for them. Warren Buffets descends from the school of value investing, arguably started by Bell Graham. He seeks out companies with a low-priced value, essentially hunting for high quality, at a low price. Something easier said than done.
The trick however, is to find a strategy that works for you as an individual. Personally, I have adapted a strategy that involves identifying secular trends and then digging deeper for intermediate trends and taking advantage of opportunities. I incorporate fundamental analysis but technical analysis is what the decision to buy is based on at the end of the day. It is a simple strategy that has lead to a continuous record of outperforming the broad market without a single losing year. I say this not to boast but to simply convey that there are methods to beating markets and all one needs to do is invest the time in learning those methods.
Looking in the rear view mirror at the past year, it further clarified to me that the investment community is just one big herd. All of them, heading in one direction waiting to be fed and slaughtered at the same time. If the market goes up, all is well and when it declines, well everyone's portfolio declines so it is not so bad. Just simply “buy and hold long-term.” It has been said that the worst thing for a man is to see his neighbor getting rich. Investors simply fear being left behind in a bull market more than they do losing money. It is mind-boggling when put on paper and read but it is unfortunately how the average individual approaches investments.
This mentality has extended to the investment newsletter business. If a writer recommends a stock and the stock declines but his subscribers are told to hold on because an explosive move upwards is just around the corner, they continue to subscribe. If he tells them to sell out of their double digit decline, they are furious, sell their stocks and cancel their subscription. Most investors simply want to win with the group and then have someone's hand to hold, for support, when faced with declines.
It is an easy scapegoat for financial advisors and brokers as you will never hear them boasting that your portfolio went up as result of a general market increase. No, they will always take credit for it. However, if your portfolio declines, the blame is simply shifted on the “bear market.” You are then told to hold for the long term but then again, you know what you signed up for.
But believe it or not, most of the time, the key to investing is actually to move with the herd but what separates the average investor, from the successful investor, is where they are positioned within that herd. The big rewards come to those who move ahead of the flock. They are not the scouts who stray ahead of the platoon nor are they on the front lines. They are the ones who wait till the all clear is given by the scout, tested by the front lines and then they move in for the easy kill. This is done by simply identifying the trend in the stock market.
The stock market is a not as complicated as most people make it out to be. It is made up four cycles; Bull, Top, Bear, Consolidation. It is the same 4 steps of growth, peak, recession, and trough that we were all taught in high school economics. Every stage in the stock market cycle can be further broken down into several steps that are driven by emotions. In the upswing, we have hope that turns into optimism, excitement, thrill and at the peak, we find outright euphoria. As the market declines, emotions slowly turn to anxiety, denial and then outright fear, finally panic and desperation hits. This is when the average Joe throws in the towel and calls his broker in search of that comfort and reassurance that he needs to “hold long-term.”
The markets then level out and base for 6-18 months. Once the consolidation is complete, that feeling of despair and depression finally turns into hope and relief and a new bull market has been born. For most investors, these emotional roller coasters take place in the long-term timeframe but for those following day-to-day action, these feelings can grip hold several times in the medium term.
I personally take on a long-term time frame and try not to make trades often but when a trade is executed, it is always well planned and thought-out. Money should never simply be thrown at the stock market just because it is “low” as many are trying to do. It is not a game of luck. Currently, we are in the trough of the emotional cycle. We are somewhere between despair and depression. This is also point of maximum potential, a point that only comes once or twice a decade. Last time we were at this crossroad was in 2002 and it offered the best buying opportunities of the decade. Anyone who bought stocks in 2002, even by throwing darts at a list, made handsome profits in the following years.
The key was realizing that 2002 was indeed, bringing with it, a bottom. Short-term bottoms are not easy to call, in my opinion, but long-term bottoms are very easy if you use the correct tools. The stock market always goes through a bottoming process. It entails several retests of the lows, thereby confirming that the market refuses to head lower. During this consolidation phase the market provides us with vital information as to where we are headed next.
One of the most useful tools is the Advance/Decline line which is used to confirm the strength of a current trend. As the market transitions from a consolidation phase to a bull phase, several sectors begin to lead the pack, entering a bull market while the general indices are still consolidating. This causes the NYSE advance/decline line to diverge from the rest of the market. During 2007, we witnessed a negative divergence and it was one of our main indications to get out and get short.
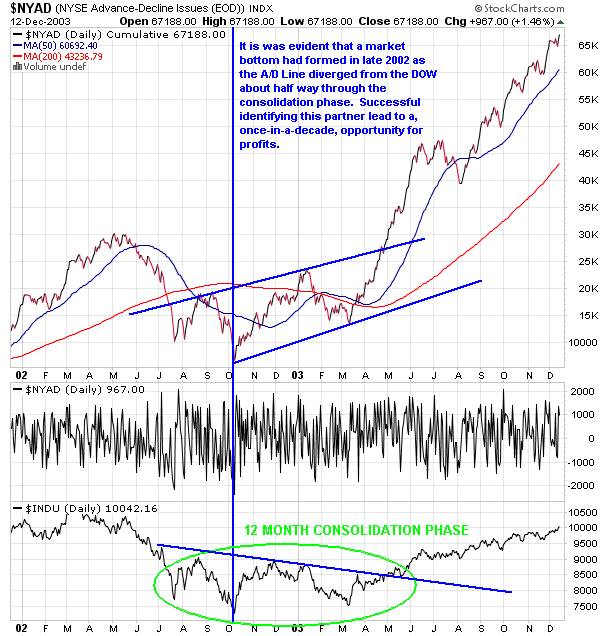
This method can be applied to virtually all market tops and bottoms. In 2002, the market completed its bear phase and by the second quarter, was in a stage of consolidation. By the third quarter, the Advance/Decline Line began turning positive while the market continued its grind. It indicated that several sectors had begun a new bull market, ahead of the broad market. As year progressed, more sectors joined the lead and by 2003 we were in a full-blown bull market. Anyone who recognized what the charts were conveying was able to position themselves for the biggest bull market of the decade.
This is exactly what I believe to be awaiting us in 2009. The year will be reminiscent of 2002, a year of consolidation. There are already indications that the A/D line is holding up much better than the three main indices but consolidation phases always take months to play out so no rush is necessary.
However, as we continue to grind our way through the year, several sectors will end their bottoming process and begin to turn positive. These sectors will be the leaders tomorrow. They will top the charts as the biggest gainers of 2009 and 2010. There are already several that are showing great relative strength and are vastly outperforming the markets. Current indications are many of them may already be completing their consolidation phase and are gearing up for the bull phase.
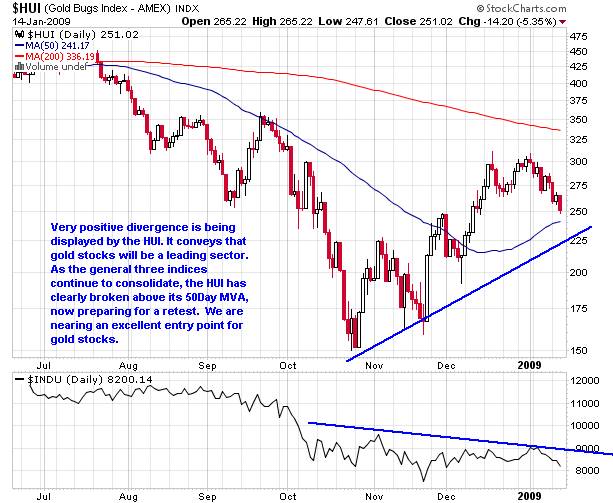
Gold stocks have been showing great strength relative to the general markets. Notice the HUI bottomed out much earlier than the general markets, October versus November, a bullish indication. Furthermore, it is evident that the HUI will be nowhere near its lows as the DOW gears up to challenge the 7500 lows. It is an extremely positive indication going forward. Anyone looking to take positions in gold stocks should be prepared to do so in the coming days as it heads toward the 50-day MVA and support line.
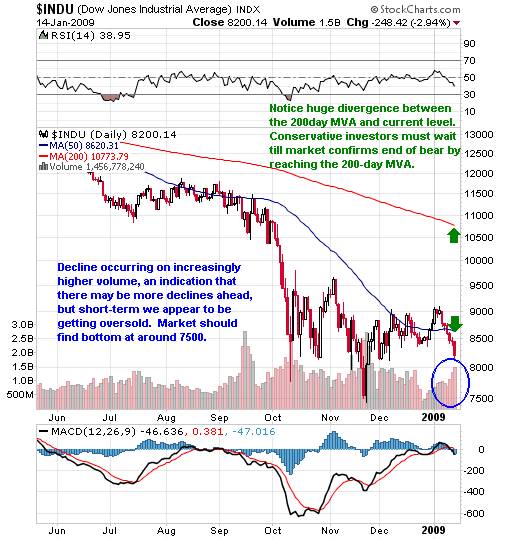
Another useful indicator of a market top or bottom is the daily moving average. The market is considered to be in a bear market when we are trending below the 200-day MVA. A signal to conservative investors, that it is safe to get back in, will be a break above the trend lend. It will be the first indication that the bear market is officially over. It is simply a return to the norm, the 200-day MVA will be reached once again it is just a question of when. Judging by current charts, the DOW will not breach the 200-day MVA until much later this year. It was a great tool for us in 2007 to further confirm our belief in the coming bear market. However, by using other indicators, we expect to know much earlier when the current market has phased into a bull market.
SHORT-TERM UPDATE:
It appears the market is set to make a major bottom, at its former lows, in the coming days. We initially had debated whether this market will continue its uptrend for a few more weeks and then retract to November lows. But it has now become clear we are in the midst of the final decline. This will set the stage for the much lauded “Obama Rally” that we believe may take us over 10,000, up to the 200-day MVA. This process will last into the spring, providing us with ample opportunity to profit from our current positions as well as new ones that we will be adding over the coming days.
Our longer-term prediction is that eventually, the 200-day MVA will provide key resistance that will bring the rise to a halt, a couple months from now. Once the advance shows signs of exhaustion, we will look to exit positions with handsome profits and potentially establish new shorts. It will usher in the final market decline, back once again to the November bottom. It will create a “triple bottom” that should hold for many years to come. At that point, all conservative investors and those looking invest 401Ks will be able to safely scale in.
Over the coming days, we will be examining and updating subscribers on more sectors that we feel are increasingly showing promise. We are especially taking note of the airline sector and will be updating charts and shortly releasing an analysis to subscribers. It is a sector that has seen a 95% decline since 1998 and is probably one of the most despised by investors but the charts are indicating that it may be the strongest contender to lead us out of the consolidation phase.
By Daniel Smolski
smolski@gmail.com - Smolski Investment Newsletter
For a limited time , we are opening our services to new subscribers and are currently offering a FREE trial to the Smolski Investment Newsletter. We had an extremely profitable year in 2008 but we strongly believe 2009 will be one of the best in a long time; those correctly positioned will reap the biggest rewards. In the next few weeks, we will continue to monitor the markets and specify which sectors are poised to provide the greatest returns. Do not hesitate to send us an email with “SIGN UP” as the subject line at smolski@gmail.com .
© 2009 Copyright Daniel Smolski - All Rights Reserved
Disclaimer: The above is a matter of opinion provided for general information purposes only and is not intended as investment advice. Information and analysis above are derived from sources and utilising methods believed to be reliable, but we cannot accept responsibility for any losses you may incur as a result of this analysis. Individuals should consult with their personal financial advisors.
Daniel Smolski Archive |
© 2005-2022 http://www.MarketOracle.co.uk - The Market Oracle is a FREE Daily Financial Markets Analysis & Forecasting online publication.