


Soaring Unemployment Means No U.S. Housing Market Bottom
Housing-Market / US Housing Feb 01, 2009 - 12:07 PM GMTBy: Mike_Shedlock

 California Association of Realtors C.A.R. Data
The following chart is from my friend "TC" who has been monitoring California Association of Realtors (C.A.R.) and DQNews data. C.A.R. data contains resale single family residences and new homes. DQNews data contains resale single family residences and new homes.
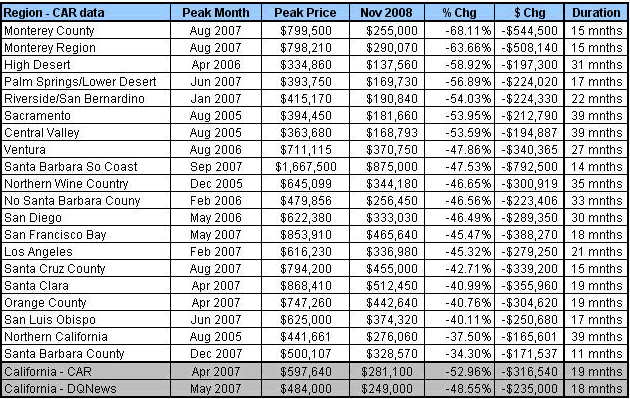
Median nominal prices in CA are now down 53% according to CAR and 48% according to DQNews - and those declines are in 19-20 months!
Case-Shiller is a more accurate way of looking at home prices than median prices. Case-Shiller data follows.
Case Shiller January 2009 Release
Inquiring minds are considering the Case Shiller Home Price Release for January 2009.
Home Price Declines Continue as the S&P/Case-Shiller Home Prices Indices Set New Record Annual Declines.
New York, January 27, 2009 – Data through November 2008, released today by Standard & Poor's for its S&P/Case-Shiller1 Home Price Indices, the leading measure of U.S. home prices, shows continued broad based declines in the prices of existing single family homes across the United States, with 11 of the 20 metro areas showing record rates of annual decline, and 14 reporting declines in excess of 10% versus November 2007.
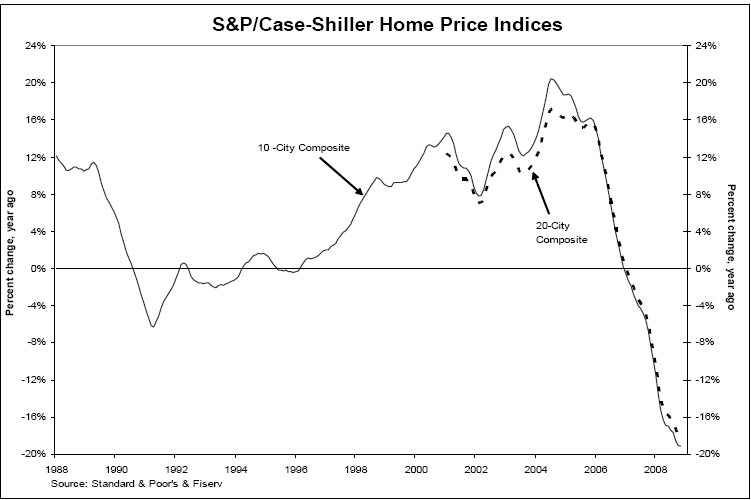
The chart above depicts the annual returns of the 10-City Composite and the 20-City Composite Home Price Indices. Following the lead of the 11 metro areas described above, the 10-City Composite matched last month's record decline of 19.1% and the 20-City Composites set a new record, down 18.2%.
“The freefall in residential real estate continued through November 2008,” says David M. Blitzer, Chairman of the Index Committee at Standard & Poor's. “Since August 2006, the 10-City and 20-City Composites have declined every month – a total of 28 consecutive months.
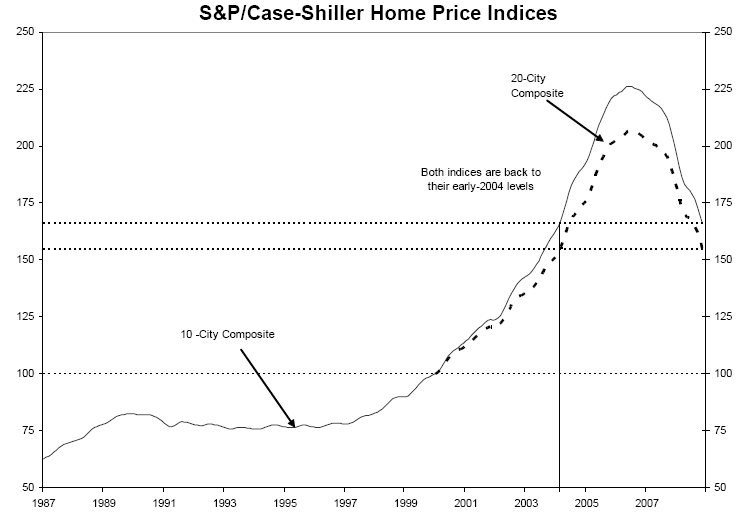
The chart above shows the index levels for the 10-City Composite and 20-City Composite Home Price Indices. It is another illustration of the magnitude of the decline in home prices over the past two years.
Please see the original article for more commentary and tables on the data.
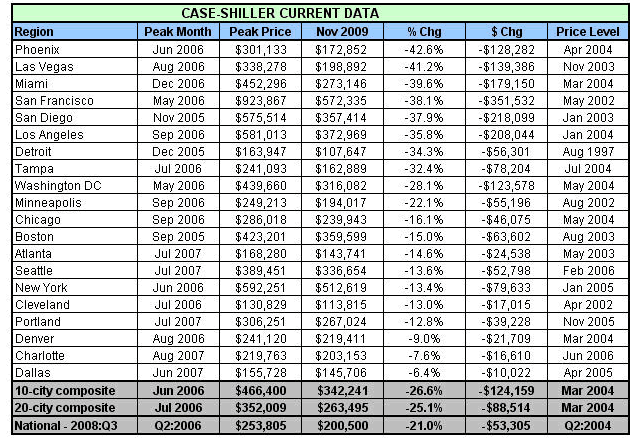
Case-Shiller Declines Since Peak
The following charts were produced by my friend "TC" who has been monitoring Case-Shiller Data. Although individual cities topped at varying times, the top-10 and top-20 city composites peaked in a June-July 2006 timeframe.
Case-Shiller Declines Since Peak Current Data
Case-Shiller Declines Since Peak Futures Data
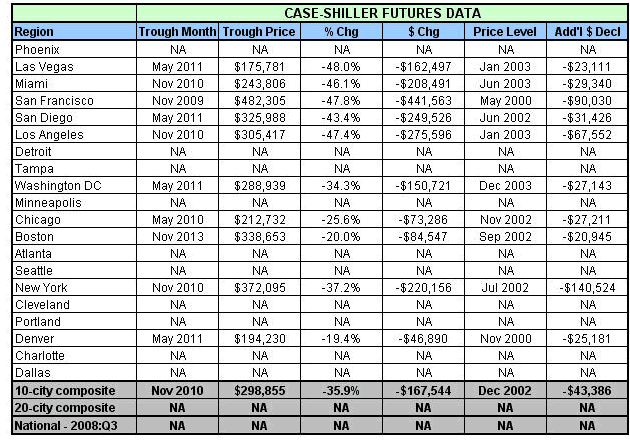
"TC" writes:
The Nov 2008 Case-Shiller data continues to accelerate to the downside. The 10 and 20 city index show declines from their peak in excess of 25% and the bubble cities (along with Detroit) all have declines in excess of 30% with Phoenix having the largest percentage drop of -43% and San Francisco having the largest price drop at $351,000+.
It is important for readers to know that Case-Shiller uses a Repeated Sales Methodology (RSM) which provides the most accurate housing data available. Additionally, as requested I've added two columns titled "Price Level" which show both the last time prices were at the current level and what price level prices are projected to decline to based upon the CME Futures market.
The most extreme bubble city decline is once again San Francisco which is at prices last seen in May 2002. However, the most extreme overall city is Detroit which has now reverted to prices last seen in Aug 1997.
This additional data is even more interesting when you look at the projected trough months. For example, Los Angeles is expected to trough in Nov 2010 at prices last seen in Jan 2003. However, those Jan 2003 prices are an amazing 44% higher than LA prices were in Jan 2000. Consequently, we can certainly go a lot lower and it appears that even the Futures market may be too optimistic about when this market bottoms.
Lastly, the sheer number of negative quarters in every city continues to amaze as 14 of the 20 cities have now experienced 9 or more consecutive quarters of prices declines!
Thanks "TC"
Those wanting to see still more graphs of housing and other data should take a peek at another fine post by Calculated Risk called January Economic Summary in Graphs .
My take is unemployment is going to soar in 2009 along with foreclosures, credit card writeoffs, and bankruptcies. Those will add to the inventory problems. Thus it is extremely unlikely that housing bottoms anytime soon.
And as much as housing prices have declined, take another look at the second chart in the news release above. Imagine where prices will be if they fall back to 2003 levels or worse yet 2001 levels. Moreover, why shouldn't prices fall back that far? Finally, how many are prepared for it, if indeed that were that to happen?
By Mike "Mish" Shedlock
http://globaleconomicanalysis.blogspot.com
Click Here To Scroll Thru My Recent Post List
Mike Shedlock / Mish is a registered investment advisor representative for SitkaPacific Capital Management . Sitka Pacific is an asset management firm whose goal is strong performance and low volatility, regardless of market direction.
Visit Sitka Pacific's Account Management Page to learn more about wealth management and capital preservation strategies of Sitka Pacific.
I do weekly podcasts every Thursday on HoweStreet and a brief 7 minute segment on Saturday on CKNW AM 980 in Vancouver.
When not writing about stocks or the economy I spends a great deal of time on photography and in the garden. I have over 80 magazine and book cover credits. Some of my Wisconsin and gardening images can be seen at MichaelShedlock.com .
© 2009 Mike Shedlock, All Rights Reserved
Mike Shedlock Archive |
© 2005-2022 http://www.MarketOracle.co.uk - The Market Oracle is a FREE Daily Financial Markets Analysis & Forecasting online publication.