


The Gold Silver Ratio Analysis Update
Commodities / Gold & Silver 2009 Feb 02, 2009 - 07:24 AM GMTBy: Roland_Watson

 How has the Gold Silver Ratio (GSR) been doing recently and how does this stand up against the price action of gold and silver over the past years?
Now I don't personally use this ratio to trade in and out of silver. Some people swear by it and use it as a useful tool to swap between silver and gold when one becomes undervalued relative to the other. Where I come from in Britain with the high sales tax and spreads on silver, such a pursuit is not very profitable but I know it is for others.
Where I do personally find it useful is for bigger trends in gold and silver. At one extreme, when the GSR hits 15 at the climax of a multi decade silver bull market (as in 1964-1980) it is time to seriously think about selling. When the other extreme is hit and silver is suffering in a deflationary bust, it is nigh on time to buy such as 1993 when the GSR hit 100 (only the second time in 200 years that such an event occurred). At a current value of 73 things may seem oversold for silver in GSR terms and one would have a justification for that looking at the 14 year chart below (silver price in red).
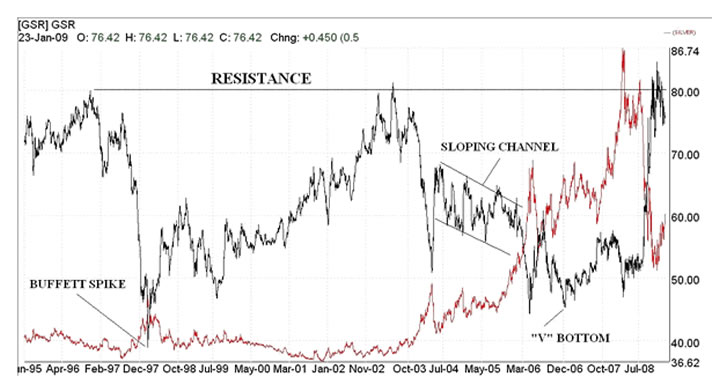
Note how the GSR recently hit a spike high of 86 as silver sold off in extremis and then began a drop downwards. Also notice that there is a line of resistance going back to just before the Buffett silver price spike where the GSR hit 78 and again in 2003 at 80 prior to the beginning of the silver bull. So it appears that the low 80s may be as bad as it gets for silver during this prolonged bear market correction. Note also that the Buffett spike was as good as the GSR got for silver these past 14 years, even better than any recent price jumps. It got to 41 but it has not dropped below 45 during this bull market.
How did the ratio perform during bear corrections such as we are in just now? If you note the comments in the chart for the 2004-2005 and 2006-2007 corrections, it was mixed. Back in 2004-2005, silver gradually outperformed gold as we can see from the sloping channel. In 2006-2007 it was a different story as silver quickly outpaced gold to form a V bottom and then gold took over as the main performer before silver took charge again towards the end of the recent price spike. Currently, the huge leap in the GSR now looks over but which way it will go from here is anyone's guess. I would tend towards the 2004-2005 sloping channel myself which would imply that the GSR will see a gradual drop in the weeks and perhaps months ahead but then enter a period of some volatility. Either way, it looks like a top was set back in late January.
By Roland Watson
http://silveranalyst.blogspot.com
Further analysis of the SLI indicator and more can be obtained by going to our silver blog at http://silveranalyst.blogspot.com where readers can obtain the first issue of The Silver Analyst free and learn about subscription details. Comments and questions are also invited via email to silveranalysis@yahoo.co.uk .
Roland Watson Archive |
© 2005-2022 http://www.MarketOracle.co.uk - The Market Oracle is a FREE Daily Financial Markets Analysis & Forecasting online publication.