


Which Way Will the Stock Market Break, Bull or Bear?
Stock-Markets / US Stock Markets Feb 05, 2009 - 03:28 AM GMTBy: Brian_Bloom

 When the Dow Jones Industrial Index broke below the lower rising trendline of the rising wedge as shown in the chart above, it gave a serious signal. (Chart courtesy Bigcharts.com)
Just how serious this development was can be determined from the following quote from Technical Analysis of Stock Trends (Edwards and Magee, at page 157)
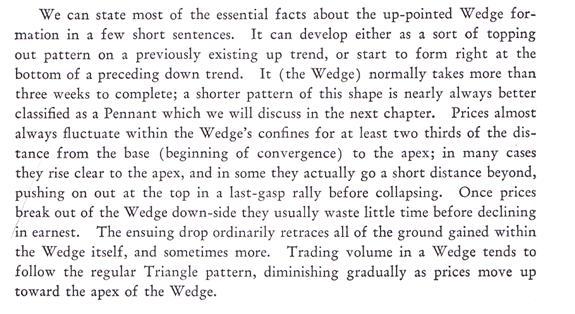
For the readers benefit, the following quote is highlighted: “The ensuing drop ordinarily traces all of the ground gained within the Wedge itself, and sometimes more.”
The reader will note that, if the retracement does go all the way back to the beginning of the formation, it will be at least to the 7,464.51 level of the DJIA.
Now let's look at a different chart of same Index (courtesy Decisionpoint.com)
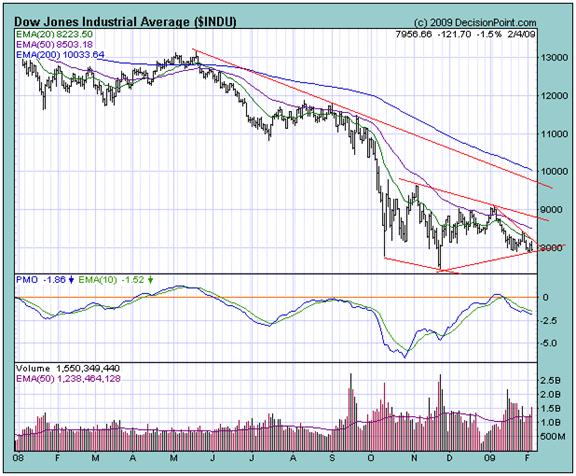
The lower rising trend line drawn in by Decisionpoint is approaching a point of decision. The chart has arrived at the intersection of two trendlines and must break one way or the other. Will it be up or down?
There are some technical analysts who might argue that the trend lines on the rising wedge in the first chart were drawn in arbitrarily and that the rising wedge is not a clear cut textbook pattern. To these analysts, my response is that nothing in this life is clear cut.
But there is more to a pattern than price movements. For example, note how, as the price rose within the rising wedge, volume fell. This is a sign that price “floated” up because of lack of selling pressure rather than a presence of buying pressure.
There are technical analyst “traders” who are calling for a break up from an oversold position because the price has fallen too far from its upper falling trendline and from its 200 day moving average against a background of oversold oscillators which are signaling a possible a retracement.
They may be right but, in this analyst's view, the charts above are weak, and to try to trade any potential bounce will be foolishly dangerous.
Why dangerous?
It will be dangerous because, if the break is on the downside, a likely consequence may be upwards of a thousand point fall within a very short space of time.
Have a look at the monthly chart below and, in particular, at the dashed line at around the 7,500 level:
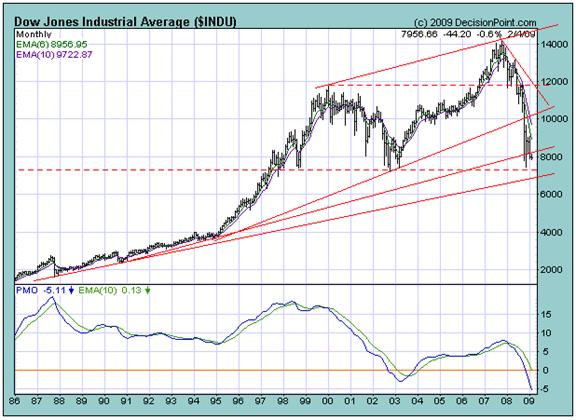
That support level is the precise level at which the rising wedge bottom commenced, and it dates back as far as 1998. If it is penetrated on the downside, the next support level will be at around 6,800 – more than 1,000 points below the current level and on the lower trendline. The reader should also note the weakness of the PMO oscillator on the monthly chart and that it is currently standing below its 2003 low. Technically, this is a bearish non confirmation that the 7,464 level was “the” bottom. The technical evidence suggests that the DJIA is very vulnerable.
With this in mind, it is this analyst's view that only a fool or a child would make a definitive call as to the likely direction of the break from the apex of the two lines in the second chart. Having said this, I must also acknowledge that I have been watching the developments in Washington regarding the proposed stimulus plan and I have this queasy feeling in my stomach that the politicians are going to bet the farm on Keynesian economic theory. I have this queasy feeling that, in so doing, they may be “forcing” a world-wide economic Depression with a capital “D”.
Let's understand what they are proposing:
The following is a quote from an article which a friend sent me this morning:
“ More than 300 million credit cards are in use today in the U.S. The average American with a credit card is carrying debt of $16,635, according to Experian. With unemployment skyrocketing, wage growth stagnant, and home equity extraction a thing of the past, some American consumers are now rationally paying down debt. The result is devastating the economy. When 72 percent of the economy is dependent upon consumers borrowing and spending, deleveraging by consumers will bring the economy to its knees.”(source: http://www.speroforum.com/,,, )
The politicians are proposing to bail out the banks by buying toxic assets. This will clean up their balance sheets (and, not incidentally, save the skins of the banks' shareholders) and the banks will be in a position to begin lending again, and wheels of commerce will begin to turn again.
Bloom question: To whom will the bailed out banks lend?
The politicians are proposing to “stimulate” the economy by building infrastructure. Enough!! The time for “sound bite” management of the economy is long past. Let's examine what this means and why, precisely, it will not work.
Here is another quote from the above article:
“The American savings rate, which was 12 percent in 1980, fell below zero in 2006. It has since inched up to 2 percent in recent months.”
Let's look at what a 2% savings rate means to the economic multiplier effect. The Xcel spreadsheet below demonstrates that, if $1,000 is invested, the $1,000 will grow to around $49,000 after 200 cycles of spending.
|
Saving Rate: |
2% |
|
| Cycle | Income | Save | Spend |
| 1 | $ 1,000 | $ 20 | $ 980 |
| 2 | $ 980 | $ 20 | $ 960 |
| 3 | $ 960 | $ 19 | $ 941 |
| 4 | $ 941 | $ 19 | $ 922 |
| 5 | $ 922 | $ 18 | $ 904 |
| . | |||
| . | |||
| 206 | $ 16 | $ 0 | $ 16 |
| 207 | $ 16 | $ 0 | $ 15 |
| $ 49,237 | $ 985 | $ 48,252 |
One problem with the logic which underlies the argument that $1,000 will eventually grow to $49,000 is that 72% of the US economy is driven by the consumer – and much of what the consumer buys is sourced outside the US economy. The system is not a closed system. Very quickly, most of the money will be siphoned out of the economy.
Another problem is that the US , until recently, was being “vaunted” as being a service economy. It is no longer a production oriented economy. So, how, precisely, will an investment in infrastructure stimulate the growth of service industries?
For example, if I need to go to the dentist and I have more money in my pocket as a result of government's ‘stimulus' then yes, I will spend some of my money at the dentist. The dentist will provide a service, which I will consume. Nothing will have been created in the way of wealth. When the original $1,000 has worked its way through the so-called multiplier cycles, the economic music will stop.
Yes, if the government spends money on bridge building (in addition to handing out condoms) then, at the end of the day, there will be another bridge in the USA . So what? Once again, when the money has worked its way through the multiplier cycles, the economic music will stop because the spending on infrastructure will have done nothing to stimulate industry .
And so we come to the final realization. The concept of a “service” economy is a mirage. Just as buildings are created by adding bricks so, wealth is created by adding real, tangible, lasting, durable value. Think of Wyle E Coyote. You cannot keep running if there is no ground below your feet. The stock market cannot defy gravity and keep on rising if the underlying economy is based primarily on paper shuffling activities and/or selling good or services whilst only a small proportion of society is actually “producing” anything.
Thirty years ago, I would have been laughed at for making this observation. Come to think of it, as recently as five years ago I was laughed at. But ridicule does not negate truth. The truth is (and now I imagine that most people will be predisposed to nod their heads in agreement) the concept of a service economy is a ridiculous nonsense. Those who grow their bank balances by providing services are growing rich on the backs of those who produce tangible things. When the majority is providing tangible things and the minority is providing services, the economy can grow and the service providers can grow disproportionately rich in parallel. But, when the majority is providing services the economic music stops. The “wealth” of many of the service providers evaporates.
What about if the USA and the UK provide their services to the rest of the world? Wouldn't they still be in the minority? Doesn't the solution lie in a globalized world?
Well, take a good look around you and you will have your answer. The BRIC Economies added together are not as large as the US economy. Furthermore, the BRIC economies are being built on a foundation of legacy technologies – all of which are dependent on a continuing stream of fossil fuels to provide the underlying energy; and we have passed Peak Oil.
Which brings us back to the original question: Which way will the Dow Jones Industrial Index break?
The answer, quite frankly, is “It doesn't make a damned difference which way it breaks.” If the underlying economy is rotten to the core, and there is no wealth building (production oriented) activity to drive it into the future, you will not make money out of the stock market.
Conclusion
The solutions to the problems which currently beset the world economy lie in tangible wealth building activities which, going forward, will be based on technologies which flow from new paradigm energy sources that are not based on Neanderthal Fire. The world's governments can do something constructive and stimulate the world economy at the foundational level of new paradigms of energy, or they can dicker around at the fringes and drive the world economy into the most serious Depression since the commencement of the Industrial Revolution in the mid 1700s.
And before you shake your head in derision, dear reader, take the trouble to read the paragraph highlighted above. Primarily, those who accumulate wealth in the future will be those who produce it.
By Brian Bloom
Beyond Neanderthal is a novel with a light hearted and entertaining fictional storyline; and with carefully researched, fact based themes. In Chapter 1 (written over a year ago) the current financial turmoil is anticipated. The rest of the 430 page novel focuses on the probable causes of this turmoil and what we might do to dig ourselves out of the quagmire we now find ourselves in. The core issue is “energy”, and the story leads the reader step-by-step on one possible path which might point a way forward. Gold plays a pivotal role in our future – not as a currency, but as a commodity with unique physical characteristics that can be harnessed to humanity's benefit. Until the current market collapse, there would have been many who questioned the validity of the arguments in Beyond Neanderthal. Now the evidence is too stark to ignore. This is a book that needs to be read by large numbers of people to make a difference. It can be ordered over the internet via www.beyondneanderthal.com
Copyright © 2009 Brian Bloom - All Rights Reserved
Disclaimer: The above is a matter of opinion provided for general information purposes only and is not intended as investment advice. Information and analysis above are derived from sources and utilising methods believed to be reliable, but we cannot accept responsibility for any losses you may incur as a result of this analysis. Individuals should consult with their personal financial advisors.
Brian Bloom Archive |
© 2005-2022 http://www.MarketOracle.co.uk - The Market Oracle is a FREE Daily Financial Markets Analysis & Forecasting online publication.