Stock Markets Fail to Bounce, Food Prices Signalling Higher Commodity Prices
Stock-Markets / Financial Markets 2009 Feb 06, 2009 - 08:53 AM GMT

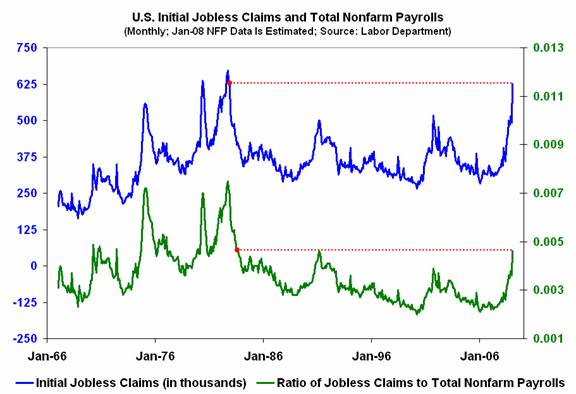
 Yesterday, the Labor Department reported that first-time claims for state unemployment benefits rose a greater-than-expected 626,000. Curiously, some commentators have downplayed the fact that claims are back to where they were more than 26 years ago because the labor pool is much larger than it was then.
However, even if you graph jobless claims relative to the number of (nonfarm) workers it paints a bleak picture. Using the most recent data (and assuming that tomorrow's jobs report is in line with expectations), the ratio has just hit its highest level since 1983, lending further support to the notion that the current downturn is the worst in decades.
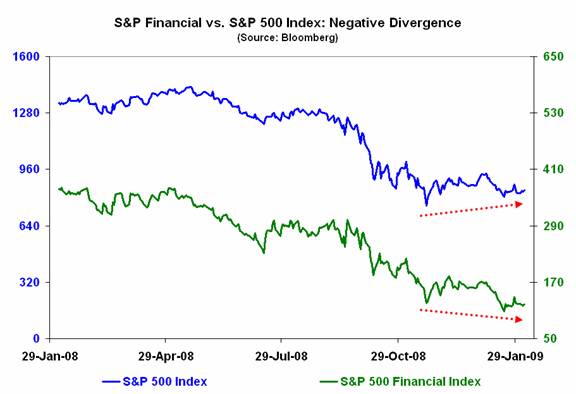
Many commentators, including me, have been looking for a decent trading bounce following the market's near-halving in value from its October 2007 peak. However, despite some signs that share prices could be tracing out a short-term bottom, the sector that has led the market all the way down remains under pressure. Consequently, while it is possible that the S&P 500 index will rally without the support of the financials, the odds are against it.
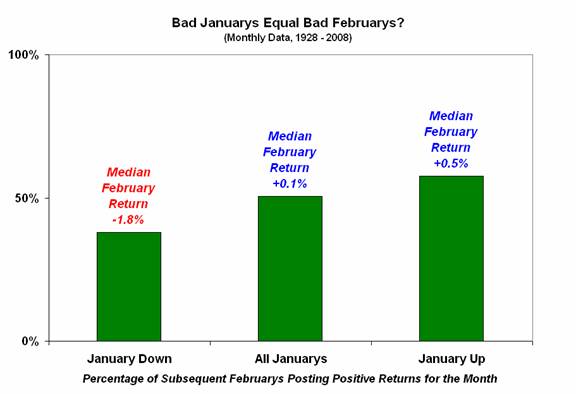
Last month, the S&P 500 index fell 8.6%, which was the worst January performance on record. Naturally, that has some people wondering if this month will turn out any better. Unfortunately, history suggests otherwise.
Since 1928, the market has declined in the first month of the year on 29 out of 81 occasions, or 35.8% of the time. The median loss during those losing Januarys has been 3.8%, versus an overall average gain of 1.6%.
On balance, performance in the month after a weak January has also been a downer. Over the past eight decades, the follow-on February has seen the S&P 500 decline on 18 separate occasions, or 62.1% of the time, with a median loss of 1.8%. That compares to an average rise of 0.1% for all Februarys from 1928 - 2008.
One more reason, I guess, to be cautious about playing the bounce.
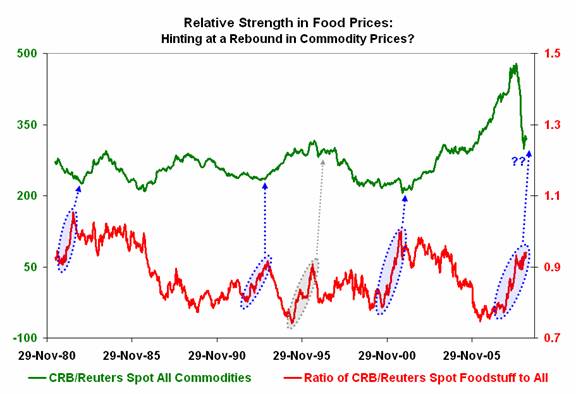
Although not infallible, a sustained rise in the ratio of spot food prices to overall commodity prices has been a bullish indicator, albeit one with a fairly long lead time. Given that the ratio has been rising since November 2007 and is approaching levels that preceded noteworthy upside reversals in early-1983 and late-2001, it may be something worth keeping an eye on.
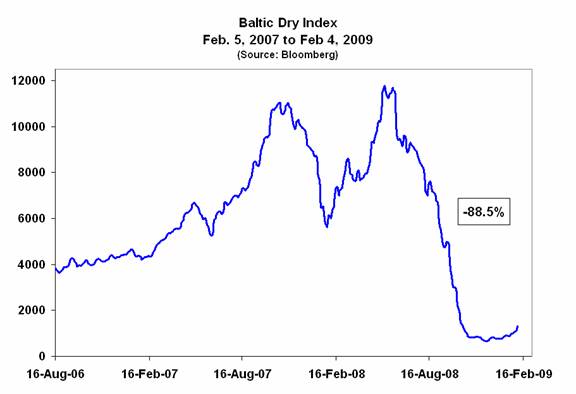
Even so, I wouldn't want to assume, as some permabulls do, that a turnaround in commodity prices and related indicators means that the economy has made a bottom. According to a blog post by Professor Mark J. Perry, editor of Carpe Diem, entitled “Baltic Dry Index: A Leading Economic Indicator,” the recent recovery in a benchmark gauge of shipping rates is a cause for optimism. Here is the graph he used to make his case:
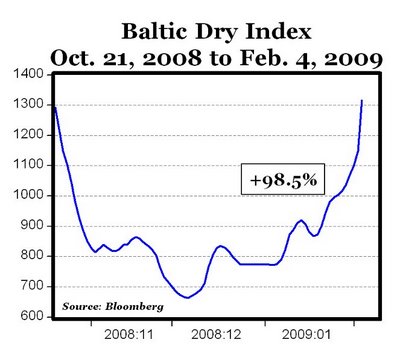
However, when you redraw the chart using data covering a somewhat longer time span, it seems to tell a very different story.
By Michael J. Panzner
http:/www.financialarmageddon.com
Copyright © 2009 Michael J. Panzner - All Rights Reserved.
Michael J. Panzner is the author of Financial Armageddon: Protecting Your Future from Four Impending Catastrophes and The New Laws of the Stock Market Jungle: An Insider's Guide to Successful Investing in a Changing World , and is a 25-year veteran of the global stock, bond, and currency markets. He has worked in New York and London for HSBC, Soros Funds, ABN Amro, Dresdner Bank, and J.P. Morgan Chase. He is also a New York Institute of Finance faculty member and a graduate of Columbia University.
Michael J. Panzner Archive |
© 2005-2022 http://www.MarketOracle.co.uk - The Market Oracle is a FREE Daily Financial Markets Analysis & Forecasting online publication.


