


US Stock Market Cycle Turning Points Report 29th April 2007
Stock-Markets / Cycles Analysis Apr 28, 2007 - 09:49 PM GMTBy: Andre_Gratian

A 3-dimensional approach to technical analysis
Cycles - Breadth - Price projections
A summary of the market position:
Long-term trend : up
Intermediate trend: up
Short-term: consolidating.
In the next 2 to 5 weeks, we will most likely arrive at the top of the intermediate trend which started
with the bottoming of the 20-wk cycle on 3/14. The cycles which lie ahead and price projections for a
top make this a high probability. A perfect scenario for the conclusion of this trend would be the
following:
- ending the current short-term correction on Monday (at the latest Tuesday)
- have a final short-term rally into the end of next week
- then have our first serious short-term correction since the 9-wk-/9-mo consolidation at the end of March with the bottoming of the 10-wk cycle,
- and then thrust into the high point of the intermediate trend, followed by a correction into
July/August.
I have illustrated this scenario on the hourly SPX chart below. The red lines are not meant to portray
the precise price level and time slots for the reversals. Only the anticipated general pattern.
Potential targets for the intermediate top are also marked on the chart. Two have already been met
and the third represents the top of the preferred range of the target zone.
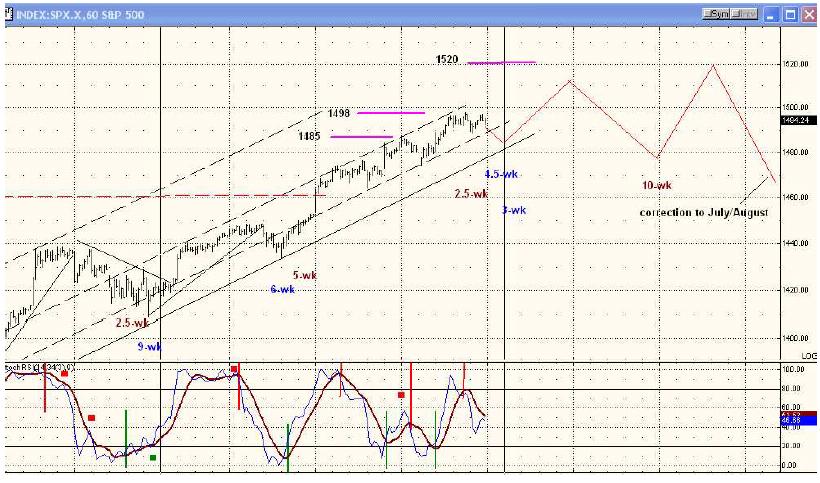
An alternative scenario would be to end the intermediate trend by the end of next week. This would
depend on significant weakness being generated by the bottoming 10-week cycle and its inability to
make new highs after it has made its low. It is not the preferred scenario, but it could happen.
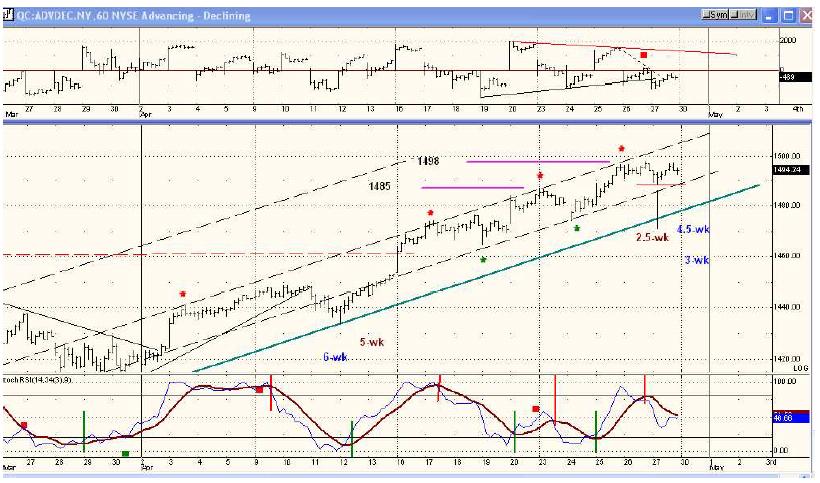
The next chart will concentrate on the very short-term and the correction which is currently taking
place. After touching the 1485 target a week ago Friday and the cycles ahead, I had expected this to
be a week-long correction. We started with a negative report on housing which dropped prices to
1474, but better than expected earnings by key companies lifted prices to the 11498 target before
pulling back again.
There are 3 minor cycles bottoming in this time frame. The 2.5wk cycle most likely made its low on
Friday exactly where it should have. The other two cycles shown have probably not bottomed yet.
At least, this is what the market action on Friday suggests. After the first dip, a labored rally took
place during which the A/D remained negative, and then prices pulled back at the close. This
suggests that the 4.5 and 3-wk low will be made on Monday (Tuesday at the latest). Monday is the
ideal low for the 4.5-wk The 3-wk is not always dependable, but could be an added bonus here.
We will know that the cycles have bottomed when prices begin to move up aggressively once again
with the support of a positive A/D. As you can see on the chart, the A/D was not ready to signal a
reversal on Friday.
The small top formation made on Thursday had a Point & Figure count down to 1485/86. The SPX
stopped at 1489 and rallied. If we can get enough weakness from the bottoming of the two
remaining cycles, we could still reach that count by Monday before ending the correction.
it is also possible -- but less likely -- that both cycles could bottom over the week-end and that we will
start Monday with a renewal of the uptrend.
Let's look at a few other details on that chart. Note how the SPX is traveling in a well-defined narrow
channel since its 1465 low. The red asterisks mark the points where the price has been stopped by
the parallel to the uptrend line. The green asterisks, where it has found support. If the index were to
move decisively above the resistance parallel, it would be bullish. Failing to reach that parallel on
the next rally would be a sign of price deceleration indicating a weakening of the trend. If it drops
below the support parallel, it would be bearish. Of course, breaking the uptrend line would be the
most bearish thing that could happen, signifying that the trend has ended.
Finally, you can see that SPX found support on the (blue) trend line which starts as 1434 on 4/12
and where prices have come to rest once again after a small bounce. If this trend line can be
penetrated to the downside on Monday, it could bring enough selling to break the support parallel as
well. But even if this occurred, it's not likely that this would constitute a serious challenge to the
overall uptrend at this time.
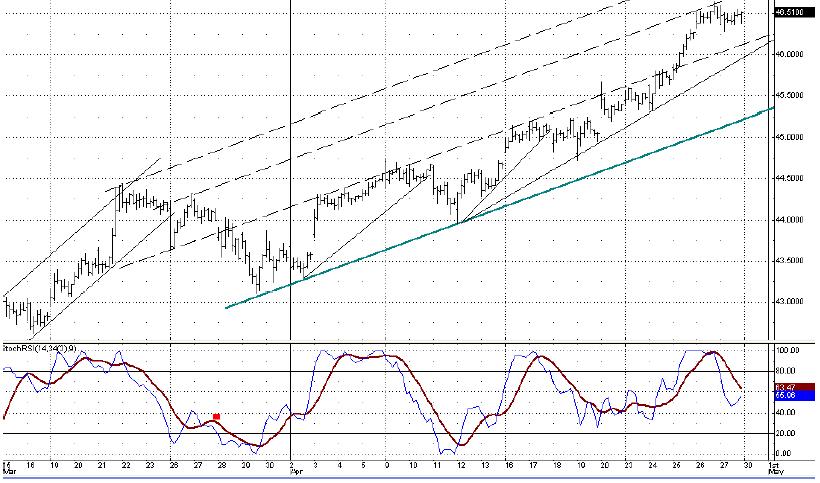
I am also including a chart of the QQQQ from the 3/14 low. This index had also been trading within
the confines of its lower trend line and the first parallel. But it recently broke through and moved up
to the next parallel where it has found resistance. The NDX is now stronger than the SPX, and this
means that the high point is still ahead. Since, historically, this index leads, we need to see it begin
to under-perform the SPX before we can conclude that a top is approaching.
Daily market analysis of the short term trend is reserved for subscribers. If you would like to sign up for a
FREE 4-week trial period of daily comments, please let me know at ajg@cybertrails.com
If this information is of value to you, you should consider our trial subscription offer (above). Daily updates consist of a
Morning Comment, Closing Comment (which occasionally includes an updated hourly chart of the SPX to illustrate the
analysis), and at least one or more updates during the trading session whenever it is warranted by market action. These
updates discuss phase completions, give projections, potential reversal points, and whatever else may be pertinent to the
short-term trend.
You may also want to visit the Market Turning Points website to familiarize yourself with my philosophy and strategy.
Just click on the link below.
By Andre Gratian
MarketTurningPoints.com
If this information is of value to you, you should consider our trial subscription offer (above). Daily updates consist of a
Morning Comment, Closing Comment (which occasionally includes an updated hourly chart of the SPX to illustrate the
analysis), and at least one or more updates during the trading session whenever it is warranted by market action. These
updates discuss phase completions, give projections, potential reversal points, and whatever else may be pertinent to the
short-term trend.
“By the Law of Periodical Repetition, everything which has happened once must happen again, and again,
and again -- and not capriciously, but at regular periods, and each thing in its own period, not another’s, and
each obeying its own law … The same Nature which delights in periodical repetition in the sky is the Nature
which orders the affairs of the earth. Let us not underrate the value of that hint.” -- Mark Twain
You may also want to visit the Market Turning Points website to familiarize yourself with my philosophy and strategy.www.marketurningpoints.com
© 2005-2022 http://www.MarketOracle.co.uk - The Market Oracle is a FREE Daily Financial Markets Analysis & Forecasting online publication.