Gold, Silver and the HUI Using the Gold Direction Indicator
Commodities / Gold & Silver 2009 Feb 17, 2009 - 06:54 AM GMTBy: Peter_Degraaf

 The long-term outlook for gold is very bullish, for to paraphrase Sir Winston Churchill's famous remark, “never before in history have so many dollars chased so few ounces of gold (and silver)”.* The mountains of currency are rising, while the number of ounces of gold produced by gold mines is dropping.
The passing of the Stimulus Bill, referred to by some as the Porkulus Bill, will add billions of dollars to an already ballooning deficit. Instead of allowing the excesses in the credit markets to work themselves out by letting healthy institutions prosper, while allowing unhealthy institutions to fail, the new administration, aided by Congress, is throwing gasoline at the fire by rewarding shoddy business practices. People like Barney Franks and Christopher Dodd, who strong-armed the banking industry to make questionable mortgage loans, are now helping to shape the decisions that will prolong the problems. The foxes are still in the henhouse.
In the 1960's it was James U. Blanchard III who pointed to the growing US deficits as the trigger that would cause gold prices to rise. In those days the deficits were still counted in millions of dollars. One wonders what Jim would say about deficits that are now counted in trillions of dollars. His advice would surely be: “Buy Gold”.
It was my pleasure to meet Jim Blanchard at one of his hard money conferences in New Orleans . Jim founded the National Committee to legalize the ownership of gold in the USA . In 1973, during the inauguration of President Nixon, Jim hired a small plane that flew near the inauguration site towing a banner that read: “Legalize Gold”.
Jim did everything with style and ingenuity. During one of his conferences he needed to move about one thousand of us from the convention hotel to a nearby convention center. He hired a marching band, and while police controlled several intersections the marching band led us to the center.
Let's now look at some charts.
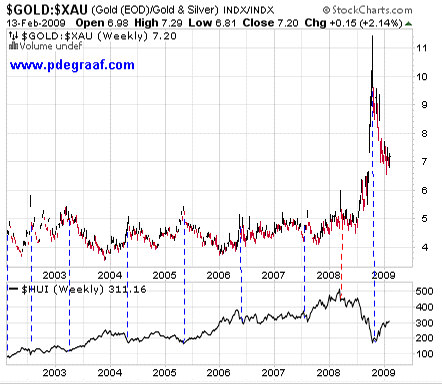
Featured is the chart (courtesy www.stockcharts.com that compares the price of gold to the XAU index (top), and compares this picture to the HUI index (bottom). The blue vertical lines draw your attention to a ‘link' when the Gold/XAU rises above 5 and the HUI index begins a multi-month rise from a bottom. The red vertical line points to the only exception to this trend, since 2002. In that last seven years this early warning signal has worked 7 out of 8 times.
The last link is the ‘mother of all signals', as the index rose to a record high of 11.5, while the Huey put in a four year bottom.
According to research done by John Hussman ( www.husmanfunds.com ); in the past, when the gold/XAU ratio reached a point above 5, while the ISM purchasing managers index registers a reading below 50 (indicating the US manufacturing sector is decreasing), gold shares advanced at an annual rate of 125%. The current reading for the PMI is 35.6%, while the gold/XAU is at 7.2.
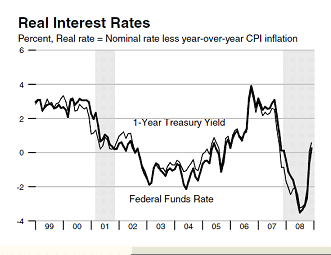
Featured is the ‘real interest rate' chart, as reported by the Federal Reserve Bank of St. Louis . The bank shows the real rate at zero percent, having risen up from -3%. If we use the figures supplied by John Williams (see next chart), we arrive at a negative ‘real interest rate' of -3.5%. Unless and until real rates turn positive by at least 2%, and for at least 6 months, we can depend on gold continuing its bull market rise.
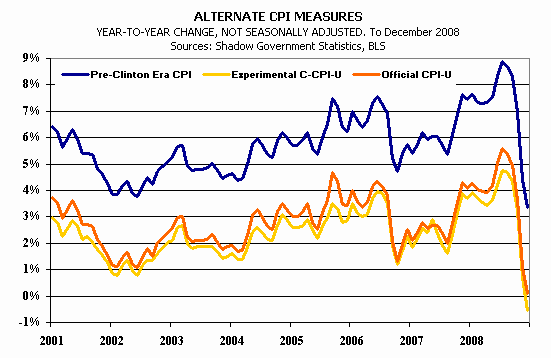
This chart courtesy www.shadowstats.com compares the official CPI rate in orange to the John Williams interpretation in blue. With the Williams CPI-U at 3.5% and short-term bills at 0% interest, the ‘real interest rates' are negative by 3.5%
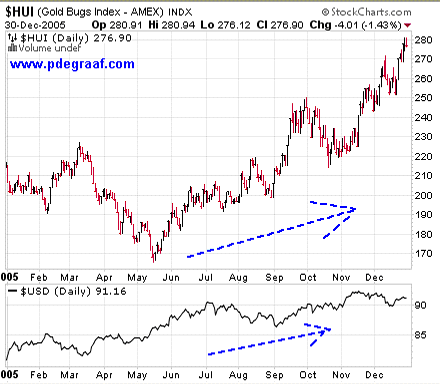
Featured is a chart (courtesy www.stockcharts.com ) that compares the HUI index to the US dollar for the year 2005. For those who feel that gold stocks cannot rise unless the US dollar falls, this chart tells us that both gold stocks and the US dollar ended the year higher than at the start of the year.
As long as other currencies, such as the Euro, Yen, Pound and Canadian dollar are having problems of their own (caused by monetary inflation), the US dollar does not need fall, and gold and gold stocks can still rise.
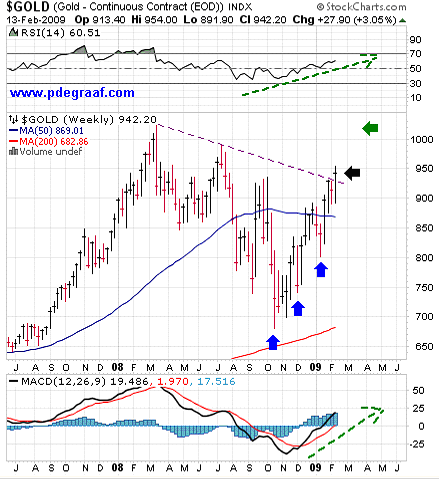
Featured is the weekly gold chart (courtesy www.stockcharts.com ) . The blue arrows point to bottoms in the 7 – 8 week gold cycle. The last 3 cycles were short, thus the expectation is that we are due for a longer one, perhaps 9 or 10 weeks. The black arrow points to the upside breakout that occurred last week. This breakout came from beneath resistance that went back all the way to March 2008 AD. The green arrow points to the target for this breakout. The supporting indicators (RSI & MACD) are positive, with room on the upside.
The Gold Direction Indicator moved up from a reading of + 20% on Feb. 9 th , when gold bullion was 895.00, to the current reading of +60% with gold bullion at 941.00
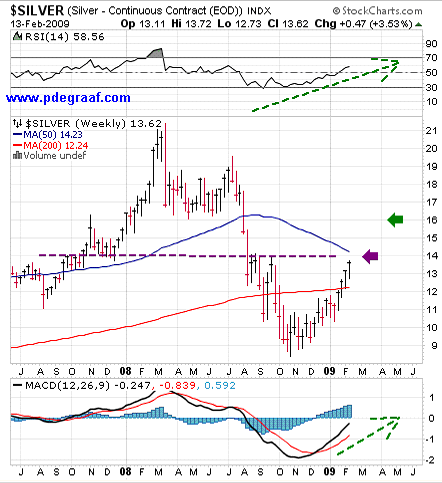
Featured is the weekly silver chart (courtesy www.stockcharts.com ) . Price has risen four weeks in a row and is expected to meet resistance at the purple arrow. Once this resistance is overcome, the target is at the green arrow. The supporting indicators, (RSI & MACD), are positive with room to rise.
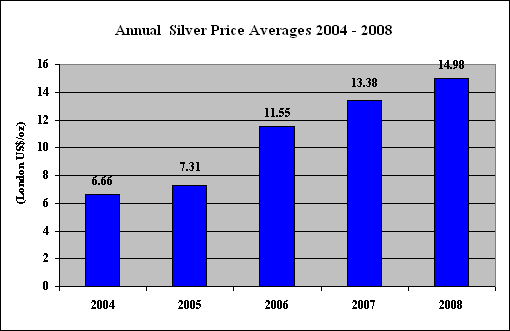
Featured is the price progression for silver during the past five years (annual average – data supplied by the Silver Institute).
Summary: Last week's breakout by the gold price confirms that the Christmas rally that started in November is ongoing. In the short-term we can expect a lot of volatility, as commercial traders and bullion banks that are ‘short' gold will do their utmost to suppress the price. They will do this by testing the current breakout. They will use the threat of ‘asset deflation' (which is has nothing to do with the effects of monetary inflation, which always lead to price inflation), and they will use the threat of IMF gold sales to try to cap the gold price rallies.
In the longer term the huge increases in currency (both paper and digital), on a worldwide basis, tell us that the gold bull still has a lot of running room left.
*(“Never in the field of human conflict was so much owed by so many to so few” – Sir Winston Churchill referring to the Battle of Britain).
By Peter Degraaf
Peter Degraaf is an on-line stock trader with over 50 years of investing experience. He issues a weekend report on the markets for his many subscribers. For a sample issue send him an E-mail at itiswell@cogeco.net , or visit his website at www.pdegraaf.com where you will find many long-term charts, as well as an interesting collection of Worthwhile Quotes that make for fascinating reading.
DISCLAIMER: Please do your own due diligence. I am NOT responsible for your trading decisions.
Peter Degraaf Archive |
© 2005-2022 http://www.MarketOracle.co.uk - The Market Oracle is a FREE Daily Financial Markets Analysis & Forecasting online publication.


