


Forecasting the Anatomy of the Stocks Bear Market Bottom
Stock-Markets / Stocks Bear Market Mar 05, 2009 - 01:32 PM GMTBy: Donald_W_Dony

 Financial forecasts, whether they are fundamentally or technically driven, are a combination of probabilities and assumptions. For example, when an analyst indicates that the earnings for a company are expected to increase during the next quarter and the business is now trading below its intrinsic value, he is suggesting that the probability of a number of issues should positively affect the near-term earnings outlook for this organization.
The assumption is that companies who trade below their true worth will eventually rise up to their intrinsic value. In other words, the fundamental evidence indicates the company is undervalued and the stock price will reflect this by advancing sometime in the near future.
This probability analysis also applies to a technical review. Mathematical models can show where the greatest likelihood of major lows will develop in the future and, coupled with historical data, the time frame for the bottom of the bear market can be estimated.
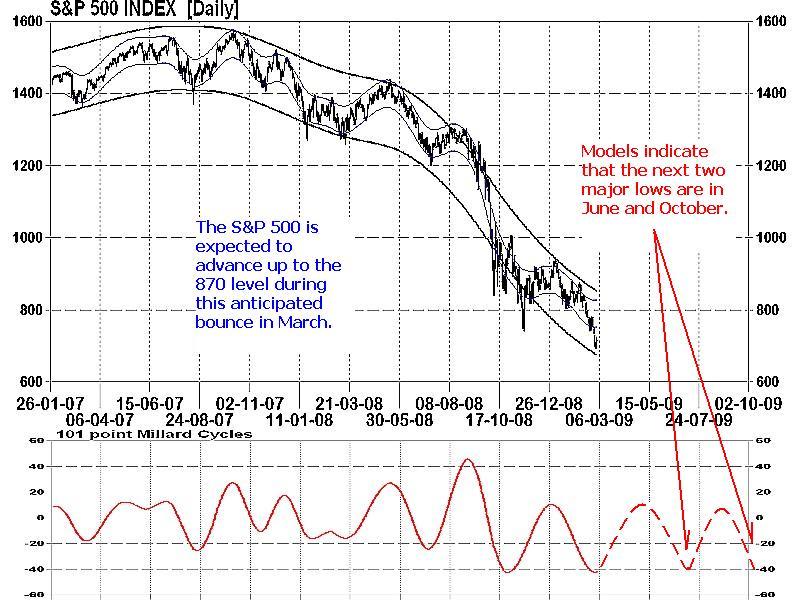
Models (lower portion of Chart 1) indicate that there are two anticipated troughs coming for the S&P 500 in 2009. As a bear market in its most simplest form is nothing more than a series of lower lows, the assumption is that price levels will be under the current price levels for the June and October troughs.
Since 1946, there has been 12 bear markets. Six of these lows have developed in October and three have occurred in May and June. This would suggest that there is a 75% probability of this current bear ending on one those months.
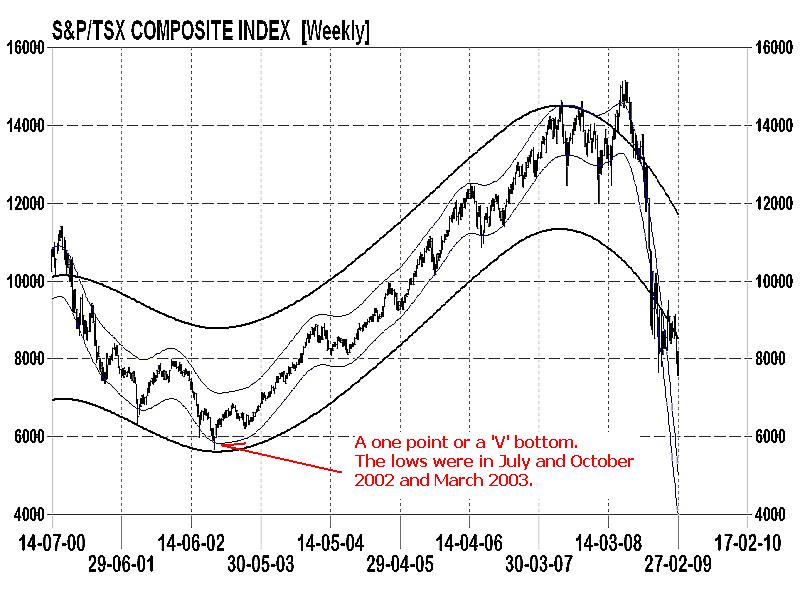
With evidence and assumptions dictating that the final low should occur this year, how will the bottom unfold? Bear market lows develop in three basic forms. Indexes either test a new low level once, twice or three times before starting a new bull market. In Charts 2-4 of the S&P/TSX, Dow Jones World Stock Index and the S&P 500, the three standard bear market bottoms are illustrated. The S&P/TSX reached a final low only once in October 2002 and than advanced. This was largely due to the strength of commodities.
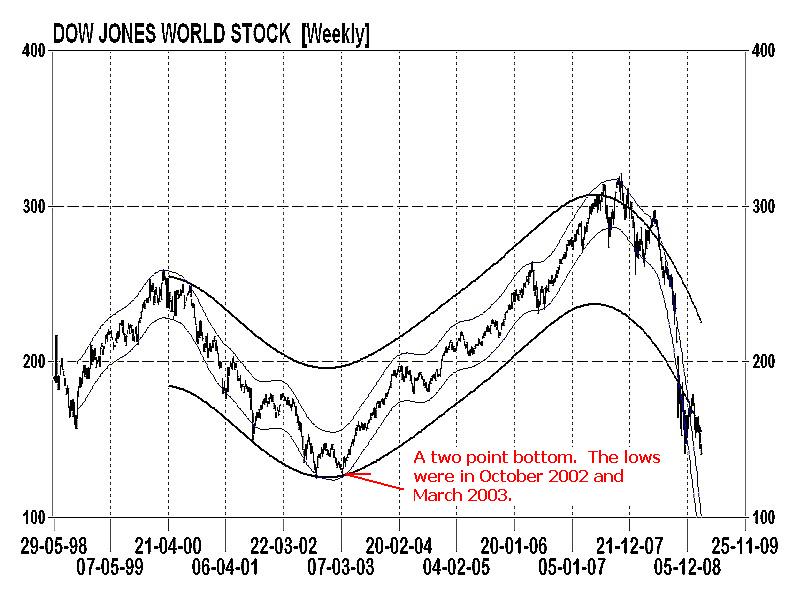
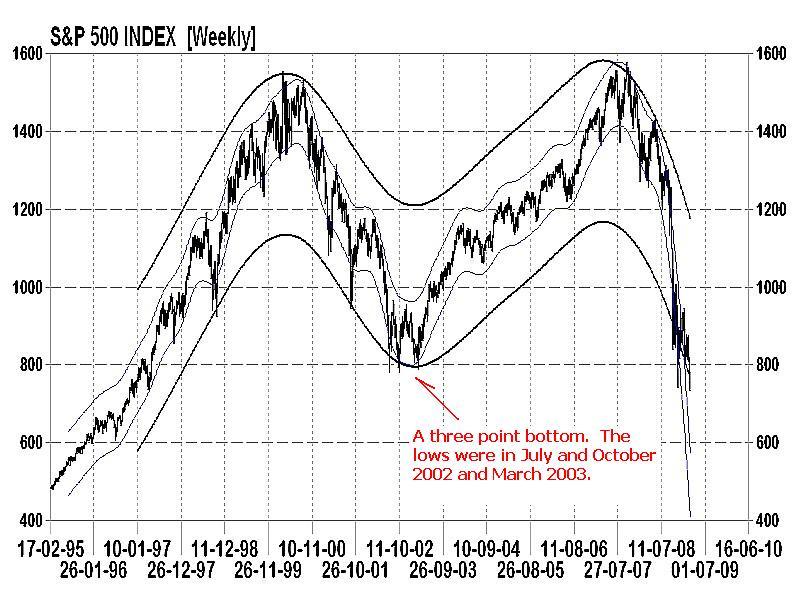
The DJ World Stock Index (Chart 3) also touched down to a new low in October but retested the same level again in March. The S&P 500, however, needed three tests at the 780 level before sufficient buying pressure occurred and propelled it into a bull market.
Bottom line: Bear market bottoms can develop in any of the three forms. However, as global equity markets are tightly linked, they typically all reach their lows during the same months and often on the same day. With models indicating that major troughs are expected in June and October this year and another in March 2010, there is a 75% probability that the last bottom of this severe bear market should occur in June or October and with a possible retest in March. The assumption is that the end will develop this year verses June or October 2010.
Additional research can be found in the March newsletter. Go to www.technicalspeculator.com and click on member login.
Your comments are always welcomed.
By Donald W. Dony, FCSI, MFTA
www.technicalspeculator.com
COPYRIGHT © 2009 Donald W. Dony
Donald W. Dony, FCSI, MFTA has been in the investment profession for over 20 years, first as a stock broker in the mid 1980's and then as the principal of D. W. Dony and Associates Inc., a financial consulting firm to present. He is the editor and publisher of the Technical Speculator, a monthly international investment newsletter, which specializes in major world equity markets, currencies, bonds and interest rates as well as the precious metals markets.
Donald is also an instructor for the Canadian Securities Institute (CSI). He is often called upon to design technical analysis training programs and to provide teaching to industry professionals on technical analysis at many of Canada's leading brokerage firms. He is a respected specialist in the area of intermarket and cycle analysis and a frequent speaker at investment conferences.
Mr. Dony is a member of the Canadian Society of Technical Analysts (CSTA) and the International Federation of Technical Analysts (IFTA).
Donald W. Dony Archive |
© 2005-2022 http://www.MarketOracle.co.uk - The Market Oracle is a FREE Daily Financial Markets Analysis & Forecasting online publication.