


The Financial Markets Last “Bubble” that Remains to be Popped
Stock-Markets / Financial Markets 2009 Mar 08, 2009 - 08:31 PM GMTBy: Clif_Droke

 The problem plaguing the market heretofore has been two-fold: a lack of buyers on the retail side and deleveraging on the institutional side of the aisle. In an all-out liquidation market cycles, support levels and technical indicators are of little to no use until the panic subsides and a level-headed approach prevails. Most of the indicators – technical and psychological – are in place for a major bottom and even the charts are starting to look somewhat constructive. We don’t have a confirmed bottom yet, though, so until we do we have to maintain a defensive position.
The market’s psychological profile in my estimation is the most important thing we can focus on right now in terms of letting us know when the bottom has absolutely arrived. Since the technical indicators and oscillators, which essentially measure the market’s overbought/oversold condition, are of questionable use right now (e.g. an “oversold” market can always become more oversold in a panic environment) we won’t place much reliance on them except as anecdotal evidence.
If this were anything other than the market we’re in now the 20-day oscillator would be sending a screaming buy signal. As it now stands all we can glean from it is that yes, the market is truly oversold and is technically vulnerable to a relief rally at any time from here…if only the institutions would stop unwinding long enough to let the market rally. In the pre-credit crisis stock market, a deeply oversold condition like the one we’re seeing now would indicate the retail investors had become overly bearish and the market would therefore be sensitive to the high level of short interest. The retail investor is no longer a major factor right now, however, and neither are the hedge funds the big market movers like they were a couple of years ago. It’s the large institutional positions that were built up on leverage during the bull market years that is the dominant factor in this market. Until very recently the ceaseless barrage of negative news headlines were used as an excuse to unload on the part of the institutions, hence the falling stock market.
The first signs of a market that finally wants to bottom will come from improved tape conditions. That is to say that when the market stops emotionally reacting to bad economic news (which in most cases market participants were fully aware of even before it was announced), we’ll have the first important sign of a change of attitude in this market. And right now attitude is everything since the market’s underlying bearish psychology has taken precedence over every other factor: technical, fundamental and cyclical.
We got the first hint that maybe, just maybe, the market’s psychological profile is changing this past Wednesday when the market reacted positively to the economic stimulus announcement by China’s government. Overseas stocks and ETFs and economically sensitive stocks and commodities were especially bullish in response to that news. Even the SPX was up over 2% for the day. Then on Friday, after a terrible U.S. nonfarm payroll report was announced, the market staged an impressive late session reversal into positive territory for the day. This isn’t enough to hang our hat on and proclaim a bottom but it’s still refreshing and yet another potential sign that maybe, just maybe this market wants to turn around. In this market we’ll take any tiny little piece of good news we can get.
Then there’s Freeport Copper & Gold (FCX). As we discussed in the previous report, FCX was up strongly on Wednesday in response to the base metals rally on the China bailout announcement. FCX rallies 13% on Wednesday, pulled back a bit on Thursday, then rallied an additional 7% on Friday to close the latest week at 33.88, which is it’s best close in almost five months. I’m not suggesting that FCX is a leading indicator for the S&P, although it has historically been a leading indicator for the XAU Gold/Silver Index. The bigger point I’m making here is that the strength in the copper and other base metals is that it could be reflecting a positive shift in sentiment on the global economy. It’s beginning to look like the market is looking ahead to an improved demand for commodities, perhaps led by a China recovery. The prospect of China leading everyone out of the global economic recession is disconcerting, for it bodes ill for America’s long-term future as the leading economic superpower. But at this point who cares; I’d rather see China lead the recovery than no one at all.
So we’re seeing a gradual uptick in positive signs pointing to what could be a bottom forming. Not just one of those temporary bottoms like we’ve from time to time seen since the beginning of 2008, but a bottom of major interim proportions.
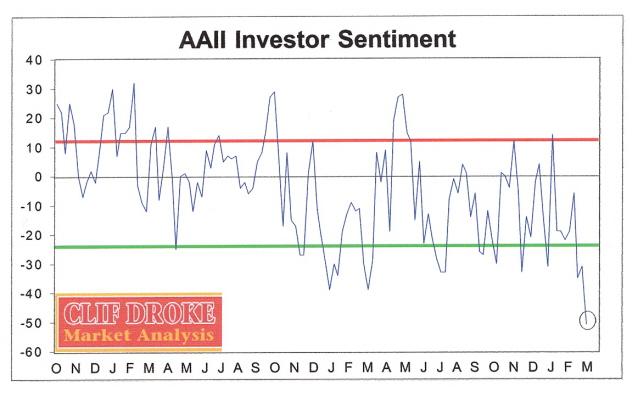
While we’re on the subject of the market’s psychological profile, let’s take a look at the latest AAII investor sentiment poll released on Thursday. It showed a record number of bearish investors, 70%, which is the highest percentage of bears in the poll’s 21-year history. Only 18% of investors were bullish. Again, this would be a screaming buy signal if we were in any other market environment than the one we’re in now. We still have to take the high percentage of bears with a grain of salt since the retail investor isn’t a major factor at this time. It’s the institutional sentiment that I’m most concerned with right now.
Now that seemingly all the major economic data have been announced in the last few days, it’s possible that the institutional mindset will become more clear-headed and focus on things other than negative headlines. There is an interim weekly Kress cycle scheduled to bottom next week, so we could see some more weakness heading into mid-week. There’s an outside possibility that the SPX will decline early in the new week, but if that happens it could be construed as good news, technically. We’ll discuss that in a minute…
The SPX violated its November lows recently and in doing so caused an even bigger wave of institutional selling. Yet our scenario which we’ve been discussing lately, comparing the current market with that of the 1982 bear market bottoming process, is still valid. I bring to your attention once again the chart of the SPX in 1982 when the final bear market low was made. Notice that the SPX broke down under its “double bottom” support and went lower before finally reversing in August that year.
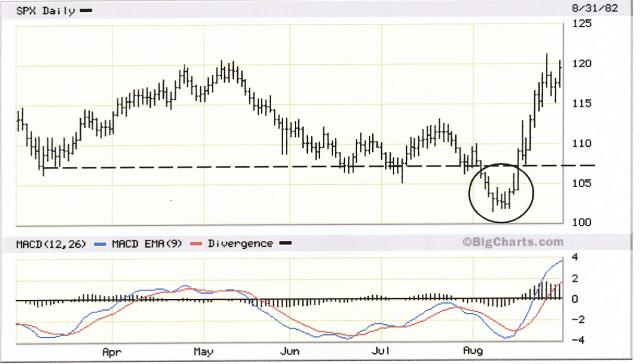
I don’t claim to know all the factors that contributed to this “head fake” lower low in the SPX in ’82 but I do know this much: while 4-year/8-year cycle was bottoming that year and accounted for the market low that year, the powerful Kress 30-year cycle was down into 1984 and was obviously exerting a negative influence in the stock market and economic environment of the early 1980s. It’s possible that the “hard down” phase of the 30-year cycle helped create the lower low in the 1982 bear market as the 4-year cycle bottomed.
This time around we have not only the 30-year cycle leaning against the market but the 40-year and 60-year cycles as well. We haven’t entered the final “hard down” phase of these cycles yet, per se, and they normally wouldn’t be contributing this much negative bias against stock prices since the 6-year and 10-year cycles are still up. But in these highly unusual circumstances where retail buying interest is virtually nil, credit is hard to get, and everyone is scared out of their wits, it allows the long-term negative cyclical bias to exert an influence. That’s my best explanation as to what we’re seeing right now.
We’ve seen there is a precedent for the market breaking under a major support and still managing to reverse its decline soon thereafter. This even occurred in the Dow Jones Industrial Average at the 2002-2003 bear market lows as well as in some other major indices. With most of the long-term Kress cycles all in the descending phase, I think we can expect to see most interim bottoms at lower lows from this point onward. All the market technicians out there who swear by “double bottoms” will have to adjust their thinking on this concept as the classic “Edward & Magee” double bottom pattern has essentially become a thing of the past.
Whenever a lateral support level is broken, and assuming there are no other major lateral support zones nearby, the next consideration for potential “support” becomes the lower boundary of an established downtrend channel. This is where the “channel buster” concept enters the equation. Downside channel busters are one of my favorite patterns (I even wrote a book on the subject a few years ago) and I’ve found downside channel busters in most cases to be more reliable to upside channel busters as far as reversing established trends. The times the S&P broke under its interim downtrend channel in October-November 2008 produced sharp counter-trend rallies as you can see in the following chart.
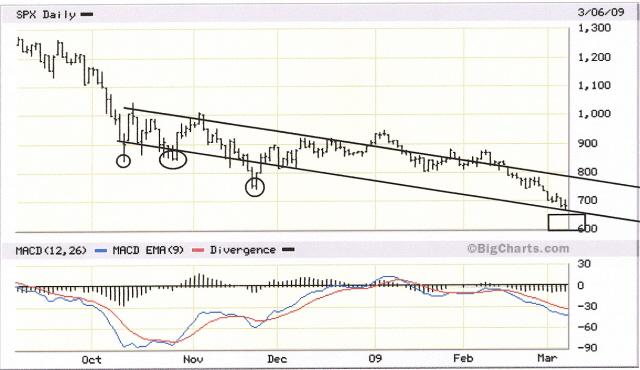
The lower channel boundary in the SPX currently intersects around the 660 level. If the SPX fall below this channel boundary next week we’ll have the beginnings of a channel buster and therefore of a potential exhaustion of the current downtrend. You’ve heard me say this before over the years and I’ll repeat it again: the more times price temporary “busts” under a channel, the more likely the trend is to reverse in a big way at some point. We saw the opposite of this in the crude oil market last summer as the oil price made a series of upside channel busters as reflected in the Crude Oil Total Return Index (OIL) shown below.
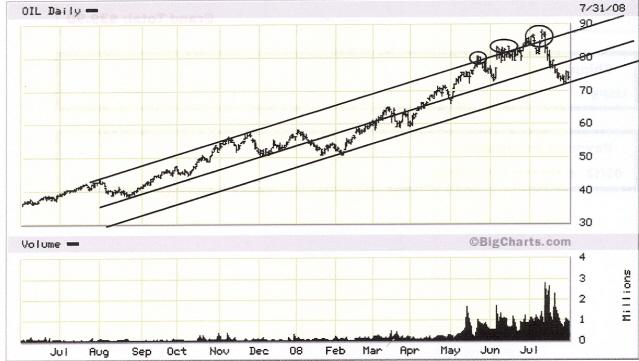
The dynamics of a major uptrend reversal are obviously much different than that of a downside trend reversal. I’m not suggesting that last year’s dramatic reversal of the oil bubble can be used as a reverse template for the next anticipated stock market reversal. My point is that multiple channel busters almost always result in reversals against the prevailing trend, especially when they occur on the downside.
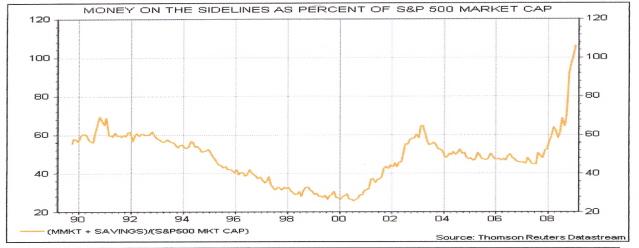
Every bubble of the past few years has been popped before our eyes: the Internet stock bubble, the housing bubble, the credit bubble and more recently the oil price bubble. Yet one more major bubble remains to be popped: the fear bubble. Yes, there is a “bubble” in fear. Even the esteemed investor Warrant Buffett made reference to a bubble in the Treasury market, which is an extension of the much larger fear bubble that has been expanding since at least 2007 if not longer. To show you just how huge this fear bubble has become, take a look at the following chart courtesy of Hays Market Focus.
Every emotional extreme always evokes its own reversal. There has never once been an exception to this rule – not once! A typical response to this would be, “But this time is different!” No my friends, it’s never different when it comes to the stock market. When we’re dealing with the market we’re dealing with primitive human nature, which never changes through time. Greed carries the seeds of its own destruction just as fear carries it own self-destruct mechanism. That’s really the basis of the cycle principle, the fact that emotional extremes always reverse when they are stretched too far in one direction. We’ve already seen greed stretched to its outer limit in the 2003-2007 bull market. Now we’re witnessing fear test its outer limits. It’s tempting to conclude that fear, unlike greed, can keep perpetuating itself ad infinitum but this conclusion isn’t supported by what we know to be true about human nature through the lens of market history.
So here we sit waiting for a changing of the guard from a market dominated by fear and foreboding to a more level-headed one. We want to see more signs that institutions are no longer panicking at the mere mention of bad news, though we got what could be called a sneak peak of that this week. More importantly, we need to see the hi-lo differential on the NYSE contract to show us that internal selling pressure is drying up – this is probably the most important thing right now, even more than price. We’ll also be on the lookout for a potential downside “channel buster” in the S&P next week as the bottoming of the latest Kress cycle may just put an end (temporary at least) to the latest rollercoaster ride on Wall Street.
By Clif Droke
www.clifdroke.com
Clif Droke is the editor of the daily Gold & Silver Stock Report. Published daily since 2002, the report provides forecasts and analysis of the leading gold, silver, uranium and energy stocks from a short-term technical standpoint. He is also the author of numerous books, including 'How to Read Chart Patterns for Greater Profits.' For more information visit www.clifdroke.com
Clif Droke Archive |
© 2005-2022 http://www.MarketOracle.co.uk - The Market Oracle is a FREE Daily Financial Markets Analysis & Forecasting online publication.