Ride the Commodities Rally on Fed Trillion Dollar Money Printing
Commodities / Gold & Silver 2009 Mar 25, 2009 - 08:56 AM GMTSean Broderick wrotes:  Industrial commodities are bouncing off their bottoms and headed higher. What's driving this move?
Simply put: The Fed has cranked up the printing presses and is throwing hundreds of billions of dollars at anyone who looks like they might buy toxic debt. This is unsticking the credit market for the short-term. And it's also lighting a fire under equities and commodities around the world as traders and investors start to bet on a recovery.
I can give you a long list of reasons why this rally is temporary, and why the government's best efforts to jump-start the economy probably won't work. But there's no arguing against the tide of money that's flowing into the market.
And that brings up the question …
How to Best Ride This Short-Term Rally?
I'll leave picking bank stocks to others who have the stomach for judging beauty contests in leper colonies. I like commodities. And they could do very well in the short-term.
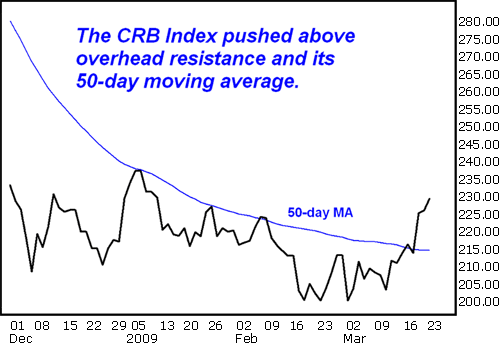
So let's take a look at the Reuters/CRB Index, which tracks 19 commodities ranging from aluminum to wheat …

The CRB is energy-heavy. And sure enough, this breakout is being led by crude oil. This is happening despite the fact that we are swimming in oil — there was a buildup of 2 million barrels last week (twice what was expected) and inventories are at the top of their range. What's more …
- The Organization of Petroleum Exporting Countries (OPEC) refuses to make any more production cuts.
- U.S. motorists cut back on driving for a record 14th straight month in January. According to the Federal Highway Administration, vehicle miles traveled fell by 7 billion, or 3.1 percent, from January 2008.
- And the three leading oil forecasters — OPEC, the International Energy Agency and the U.S. Energy Information Administration — all predict that global oil demand will fall this year.
So where's the optimism in oil?
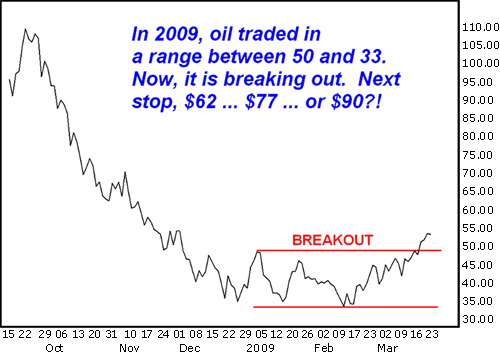
In the price! On Monday, crude oil rocketed 3 percent to its highest level in nearly four months.
Now do you want to hear some real bullishness? Crude has fallen so far, so fast, that we could see a snap-back rally drive it to $62 … $77 … heck, even $90 is possible!

Those prices would be ordinary retracement levels … a reaction to oil's swooning plunge from its high of $147 that it hit last year.
This is all speculation. After all, we aren't seeing oil inventories fall, which you would think would be a precursor to higher prices. Indeed, except for China's surging hunger for copper, many commodities haven't seen a demand increase yet.
But here are some of the developments that are fueling the speculation in oil …
* Americans are buying gas guzzlers again. Remember how you couldn't get a cut-rate price on a fuel efficient car last summer? Well, times have changed. Every small car in the market is stacked up at dealerships.
 |
| Honda Fits are piling up in dealers' lots. Meanwhile, gas guzzlers are selling like hotcakes! |
For example, at the end of February, Honda had 22,191 of its gas-sipping Fits on dealers' lots — enough to last 125 days at the current sales rate. The industry generally considers a 55- to 60-day supply healthy. As recently as July, Honda only had a nine-day supply of Fits.
And it's not just Honda. According to The Wall Street Journal , Toyota Motor Corp. has enough Yaris subcompacts to last 175 days. Chrysler LLC has a 205-day supply of the Dodge Caliber. And Chevrolet dealers are sitting on a mind-blowing 427 days' worth of Aveo subcompacts.
Meanwhile, the new, re-designed Camaro muscle car has customers lining up around the block!
* Car sales are REALLY booming in China! China's vehicle sales surged 25 percent in February, the first gain in four months. The tally in the first two months of the year rose 2.7 percent to 1.56 million. That contrasts sharply with a 39 percent decline in the United States to 1.35 million new vehicles.
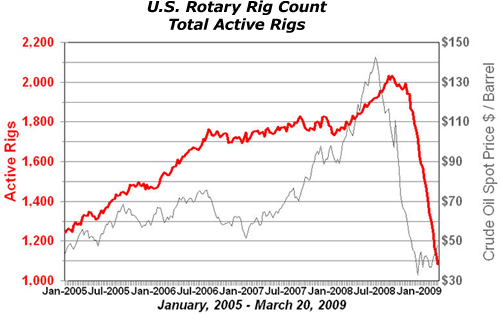
* Rig Counts Are Dropping. The number of U.S. rigs drilling for oil and natural gas is plunging. According to Baker Hughes, the number of rigs drilling for oil is down by 13, to 215. That's 126 fewer rigs than there were last year. And rigs currently drilling for oil represent just 19.8 percent of total drilling activity.
Rigs directed toward natural gas were down by 27 at 857 … 576 less than last year's level of 1,433.

Source: WTRG Economics
We should see some recovery in the rig count as prices go higher. But in the meantime, the lack of rigs actively working could lead to a supply gap — and investors are probably including that in their price calculations as well.
 |
| Rigs currently drilling for oil represent just 19.8 percent of total drilling activity. |
In fact, projects have been canceled all around the world — not just a few rigs, but huge exploration and production projects have been put on hold or outright canceled …
According to Cambridge Energy Research Associates, the scale back in exploration and production could reduce future global oil supplies by up to 7.6 million barrels per day in five years, or 9 percent of current production. If demand suddenly comes back as it did in 2003-2004, there could be a resulting shortfall of production and much higher energy prices .
And that's how you could get to $90 oil … or higher.
Add it up and you can see why traders are betting on higher energy prices. And I think that's a trend worth riding — a trend my Red-Hot Commodity ETFs members are following.
Volatility Is the Name Of the Game …
However, remember one thing — as we learned last summer, the price of oil can turn on a dime and plunge. So, I wouldn't get wedded to any long-term positions in oil. Indeed, with the markets so volatile, I wouldn't get wedded to any long-term positions in anything .
Circumstances could change down the road. But right now, this is a trader's market, one you can play on both the upside and the downside. And here are some funds you might consider to help you do just that …
On the upside …
The United States Oil Fund (USO) — This ETF seeks to track the daily spot price of West Texas sweet crude oil.
PowerShares DB Crude Oil Double Long (DXO) — This exchange-traded note aims to track twice the daily performance of the DB Optimum Yield Crude Oil Index, plus the monthly T-Bill index return.
And if you wanted to play the general rally in commodities, you could try the PowerShares DB Double Long ETN (DYY) . It aims to move twice as much as the basket of commodities in the Deutsche Bank Liquid Commodity Index - Optimum Yield.
On the downside …
PowerShares DB Crude Oil Double Short ETN (DTO). This exchange-traded note aims to track twice the inverse performance of the DB benchmark crude oil index, plus the monthly T-Bill index return.
PowerShares DB Commodity Double Short ETN (DEE) is an exchange-traded note that's designed to track twice the inverse of a basket of commodities.
With the exception of the USO, these funds are leveraged — that means they can deliver outsized returns, but they also carry twice as much risk. I think you'd be foolish to play them without using protective stops. Also, have your profit target in mind when you buy them and stick to it.
Yours for trading profits,
Sean
P.S. My blog has moved. Remember to check it out at: http://blogs.moneyandmarkets.com/red-hot-energy-and-gold/
This investment news is brought to you by Money and Markets . Money and Markets is a free daily investment newsletter from Martin D. Weiss and Weiss Research analysts offering the latest investing news and financial insights for the stock market, including tips and advice on investing in gold, energy and oil. Dr. Weiss is a leader in the fields of investing, interest rates, financial safety and economic forecasting. To view archives or subscribe, visit http://www.moneyandmarkets.com .
Money and Markets Archive |
© 2005-2022 http://www.MarketOracle.co.uk - The Market Oracle is a FREE Daily Financial Markets Analysis & Forecasting online publication.


