


Gold Short-term Bearish Signals
Commodities / Gold & Silver 2009 Apr 05, 2009 - 12:26 PM GMTBy: Merv_Burak

 It wasn't such a good week for gold and it looks like the coming week may not be that great either. My short term moving average of the price of gold has just moved below my intermediate term moving average price. This is very often a warning that a short period of negative prices is upon us. But why would gold want to go lower?
GOLD : LONG TERM
I keep thinking of that very long term chart shown here last week. It suggested a continuing weakness in the upside price movement, suggesting such movement could not last long. This week we have a continuation of weakness. The two indicators (moving average and RSI) are still mixed although the simple moving average seems to be more influenced by historical data from a year earlier than by the recent data (which is to the negative side). The momentum indicator appears more instructive here as it suggests the direction of the on going strength behind the price action, and the direction is to the down side although the actual value of the indicator is still in the positive zone. The last very long term signal given was a bear signal. That has not yet changed.
Looking over the long term point and figure chart, last shown here in my 13 March 2009 commentary, the action has now come down to the P&F support level at $900. It just needs another small move to the $885 level to issue a long term bear signal projecting, at this time, to the $705 level. The P&F is still bullish but in a very precarious position.
As for the usual indicators, my normal long term moving average line is still sloping in a positive direction and remains below the gold price. The long term RSI remains in its positive zone but is moving downwards towards its neutral line. The normal long term rating remains BULLISH.
There are times when a technician may look at different indicators or charts and come up with a variety of conclusions. Not all indicators give the same story at the same time. Some are leading indicators and some are confirming indicators. Some are even lagging indicators. One must understand what the strengths and weaknesses of these indicators are and make judgment decisions based upon historical probabilities. I have zeroed in on a few simple indicators to use for my analysis. I think they do good service most of the time.
Sometimes they are in error (or I may misinterpret them) but the benefit of technical analysis is that should your indicators put you on the wrong side of the trend, you are not there for long and the indicators will quickly correct themselves. You will not be stuck holding stock as it goes from $20 down to $2 or stick with a market that may go from a 1000 level down to 700 and wonder what went wrong. One must be prepared for errors to occur and go with the corrective action when it becomes evident. In my view the technical analysis of the on going market action is the only thing that keeps one from making HUGE mistakes. Again, mistakes WILL happen, huge mistakes are very rare using the technical approach.
INTERMEDIATE TERM
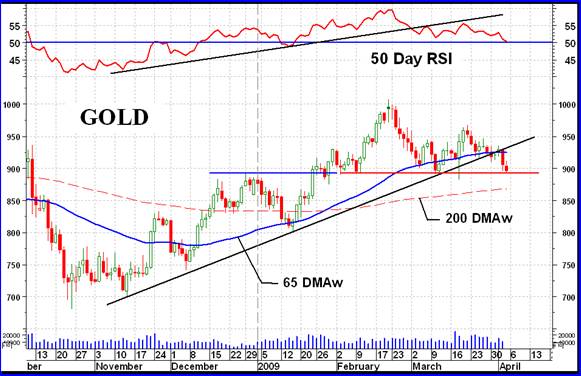
Several things of note when looking at the intermediate term chart. I call it an intermediate term chart because the indicators used reflect trends of an intermediate term nature (as opposed to short term or immediate). I have noted in the past that very often trends may be spotted and trend reversals may be seen better on a momentum indicator than on the price chart. In this case we now have both the momentum and price below their up trend lines. Both may also be considered as sitting on top of their respective support levels, the momentum right on top of its neutral line and the price right on top of its support level from previous activity. Not shown on the chart but the intermediate term momentum is below its negative sloping trigger line. One can also see the intermediate term moving average line (65 DMAw) just in the process of turning downward. Putting all this together one must assign the intermediate term rating to the BEARISH side.
SHORT TERM
As might be expected after a down week, the short term direction of motion is to the down side. Gold is below its negative sloping moving average line and the short term momentum indicator is well inside its negative zone. To go along with the negative price direction is the daily volume which is relatively low versus previous periods. The short term rating can only be considered as BEARISH at this time.
As for the direction of least resistance, well, despite the support level shown on the chart I would venture a guess that the down side will continue to be the direction of least resistance, at least for the immediate future.
SILVER
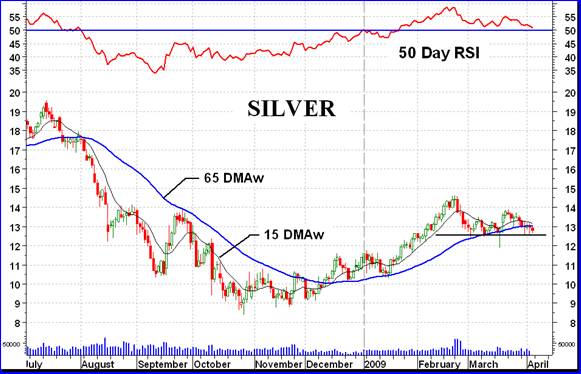
Although the week was not pleasant for silver the continuing action is still very much that of a “handle” within a bullish saucer reversal pattern. We still need a move through the $14.50 level to confirm the continuation of the bullish rally and the completion of the saucer. Other than that, the action since the November bottom has been very much like that of gold, one being stronger at times and weaker at other times. We have a support here similar to that of gold. So, without going into a whole lot of detail I would follow the analysis for gold and apply the conclusions to silver, at least for now.
Precious Metal Stocks
After mentioning (above) how fantastic the technical discipline is I thought I'd just go through an example of how it works. Hey, I'm showing how great it is so I'm going to pick a good example. I'll leave the bad examples for some other time (or someone else to point out). In the discussion my reference is to my weekly Merv's Gold & Silver 160 Index shown here. It is an Index of the AVERAGE performance of 160 gold and silver stocks, including the top 100 stocks by market value traded on the North American markets. As a weekly chart one should not try to decipher short term moves with it. It is okay for intermediate and long term analysis.
One should understand that the time period used for analysis determines how quickly one can confirm reversals of trend. One should not expect to confirm a reversal right at the bottom or top. The longer the time period under review, the longer the time period indicators and the further away from the very bottom or top one confirms a reversal. Let's look at the intermediate term period.
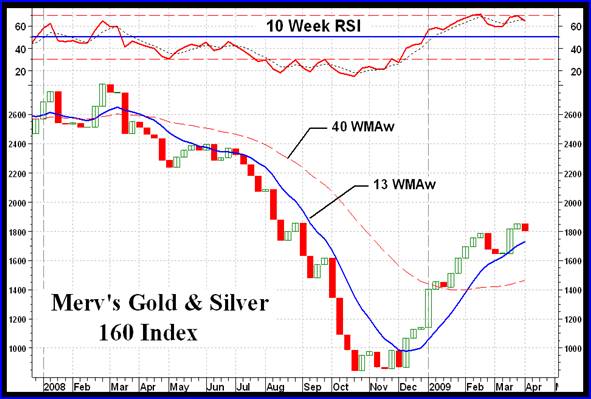
To determine intermediate term moves two of my simple indicators are the 65 day weighted moving average (or the 13 week average) and the 50 day Relative Strength Index (RSI) (or the 10 week RSI). I use other stuff but those are the very basics.
A simple fact of life, as long as the Index is below a negative sloping moving average line you are continuing to be in trouble and as long as the Index is above a positive sloping moving average line things continue to look good. There are, of course, transition periods when the Index is in a bottoming or topping process when it may not be advisable to sell or buy respectively. Here, the momentum indicator comes into play.
The momentum indicator attempts to warn you of periods when the strength of the Index action may be getting stronger or weaker. This puts one on notice that a reversal of trend may be ahead. The final statement by the indicator of a change in strength from negative to positive is the crossing of its neutral (50%) line. However, long before that crossing the indicator usually transmits a message that the strength of the Index moves are strengthening (or weakening).even as one cannot see any such suggestion from the Index itself.
From late July to the end of Nov as the Index plunged and then moved sideways the RSI was moving in a sideways path setting up a solid level of resistance at the 30% level. From mid-Oct to end of Nov as the Index moved sideways the RSI was moving upwards gaining in strength suggesting an underlying strengthening in the Index even though the Index itself was moving sideways. On Friday 12 Dec 2008 the Index broke above its moving average line and the line turned upwards, a very strong reversal sign. The RSI at the same time, although still in its negative zone, broke above a 4 month resistance level confirming the strengthening process of the Index and the reversal of trend. Since then the Index has climbed 70% (not from the bottom but from the break-out point).
So, what can we decipher now?
The Index is still above its positive sloping moving average line. Great, so far so good. However, there is a warning coming from the RSI action. Although the Index made a new recovery high the other week, the RSI DID NOT . The RSI was giving a warning that the new high was made on reduced strength in the Index move. This is often referred to as a negative divergence and should be carefully watched. I call these “warnings” as the momentum indicator should not be used by itself to confirm a reversal of trend even though that's what they often end up to be.
So, what should a person in the stock market do at this point. Well, my view would be to be sure that a stock has extra technical strength before going on the buy side and to be somewhat more aggressive with my stop losses on the sell side.
At this point some sharp eyed reader will say, hey, what about that period at the beginning of 2008? Things were going up and down and up and down. It wasn't as clear cut as the end of 2008. Well yes, there was a period of one or two whip-saw effects at that time. One might have lost a small amount of capital during such whip-saw. I have just presented the very simple basics here, there is a lot more to technical analysis than just the basics but this is not the place for a full lecture series. But even if one should lose during a whip-saw, that's better than holding for dear life ALL THE WAY DOWN. You still end up with most of your capital in your hands ready to invest later (in Dec) at much, much lower prices.
Well, so much for our lesson of the day. I think I'll end here. The Table of Indices follows on the next page.
Merv's Precious Metals Indices Table
Well, that's it another week.
By Merv Burak, CMT
Hudson Aero/Systems Inc.
Technical Information Group
for Merv's Precious Metals Central
For DAILY Uranium stock commentary and WEEKLY Uranium market update check out my new Technically Uranium with Merv blog at http://techuranium.blogspot.com .
During the day Merv practices his engineering profession as a Consulting Aerospace Engineer. Once the sun goes down and night descends upon the earth Merv dons his other hat as a Chartered Market Technician ( CMT ) and tries to decipher what's going on in the securities markets. As an underground surveyor in the gold mines of Canada 's Northwest Territories in his youth, Merv has a soft spot for the gold industry and has developed several Gold Indices reflecting different aspects of the industry. As a basically lazy individual Merv's driving focus is to KEEP IT SIMPLE .
To find out more about Merv's various Gold Indices and component stocks, please visit http://preciousmetalscentral.com . There you will find samples of the Indices and their component stocks plus other publications of interest to gold investors.
Before you invest, Always check your market timing with a Qualified Professional Market Technician
Merv Burak Archive |
© 2005-2022 http://www.MarketOracle.co.uk - The Market Oracle is a FREE Daily Financial Markets Analysis & Forecasting online publication.