


Stock Market Investor Sentiment: Time To Sell the Bear Market Rally
Stock-Markets / Stocks Bear Market Apr 20, 2009 - 06:24 AM GMTBy: Guy_Lerner

 This is now the fifth week in a row where investor sentiment, as measured by the "Dumb Money" indicator, remains neutral. When we couple this with the fact that prices on the major stock indices remain below their 40 week moving averages, there is a high likelihood that the market will rollover in the next several weeks. I have previously discussed these observations in the article, "Investor Sentiment: Some Context".
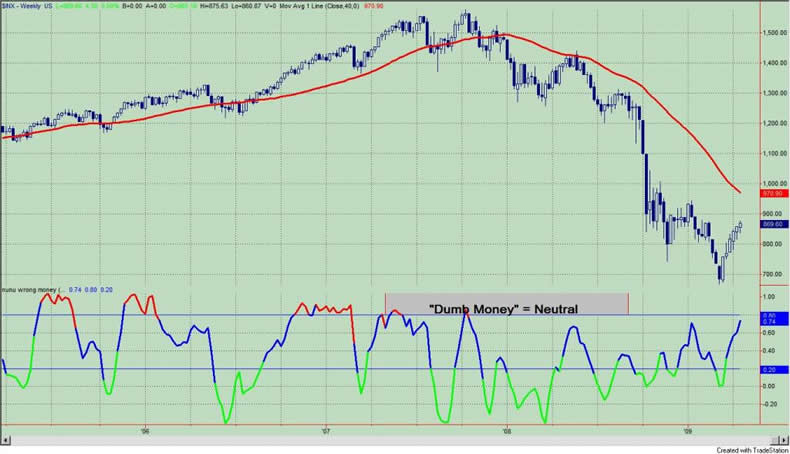
The "Dumb Money" indicator is shown in figure 1, and it is in the neutral zone. The "dumb money" looks for extremes in the data from 4 different groups of investors who historically have been wrong on the market: 1) Investor Intelligence; 2) Market Vane; 3) American Association of Individual Investors; and 4) the put call ratio.
Figure 1. "Dumb Money"/weekly
The "Smart Money" indicator is shown in figure 2 (middle panel). The "smart money" indicator is a composite of the following data: 1) public to specialist short ratio; 2) specialist short to total short ratio; 3) SP100 option traders. I have placed the "Dumb Money" indicator in the lower panel.
Figure 2. "Smart Money" and "Dumb Money"/ weekly
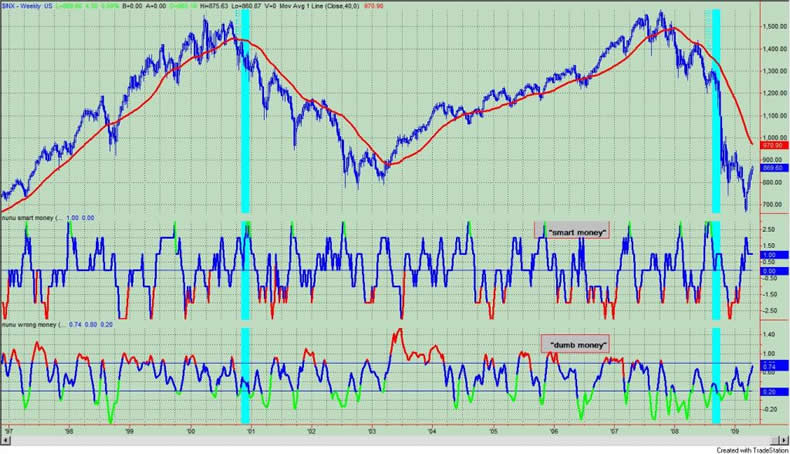
The "smart money" remains neutral and this is surprising considering the 20 plus percent run in the major indices over the past 6 weeks. In the prior 11 observations, when the "dumb money" was neutral with prices below the 40 week moving average, the "smart money" was bearish 9 out of 11 times. In other words, the "Smart Money" and "Dumb Money" indicators were pretty much in sync.
In the other 2 observations, the "Smart Money" was neutral to bullish. These were in December, 2000 and September, 2008. Several weeks following this confluence of signals the market were significantly lower. In essence, the "smart money" was wrong. These 2 observations are noted with the teal vertical lines in figure 2. Therefore, I attach no significance to the divergence between these two indicators.
While some readers may interpret these observations on the "dumb money" and "smart money" as an outright sell signal or carte blanche to short the market, I tend to view this kind of market environment as an opportunity to take profits especially on spikes in prices or by tightening stops or as major milestones are made (i.e., a tag of the 200 day moving average). I do not view this as a time to establish new long positions. Typically, market tops are drawn out affairs that could last weeks.
In addition, readers need to understand that ultimately this may not be the correct play, but it is the high odds play. This is not meant to back off from the observations that I have made or to diminish the quality of my work. The prior 11 observations of this set up have been fairly consistent. This is a bear market rally until proven otherwise, and the burden is on the bulls. If wrong, there is always important information in failed signals.
© 2005-2022 http://www.MarketOracle.co.uk - The Market Oracle is a FREE Daily Financial Markets Analysis & Forecasting online publication.