Stock Market Trends Pattern Recognition Time
Stock-Markets / Stocks Bear Market May 25, 2009 - 01:37 PM GMTBy: Captain_Hook
 The dollar ($) is breaking down, and everybody is watching (including the Chinese), so it must be time to throw a deleveraging scare back into the market to affect a rally and support Treasuries. This is what the good conspiracy theorists are thinking right now. And you know what, not coincidentally this is actually the way things just might play out, looking like the markets are being managed right when it’s needed. In fact however, this time around price managers are getting a great deal of help from speculators who continue to bet wrong, where another rally in stocks (and test of support for the $) after a brief sell-off here would look like just what the doctor ordered from a price management perspective (equities must remain firm for re-inflation efforts to take hold), but in fact would be more the result of renewed bearish speculation within the context of our faulty and fraudulent market mechanisms.
The idea is by throwing a deflation scare into the market right when the charts / cycles are suggesting such an outcome is possible (a – b – c corrections across the equity complex could be completed), speculators begin betting aggressive on a renewal of secular trends lower. This view applies to everything from stocks, which are in fact sufficiently overbought to justify a correction at anytime to crude oil (commodities), which appears to be completing a lesser degree a – b – c correction discussed above.
The following is an excerpt from commentary that originally appeared at Treasure Chests for the benefit of subscribers on Tuesday, May 12th, 2009
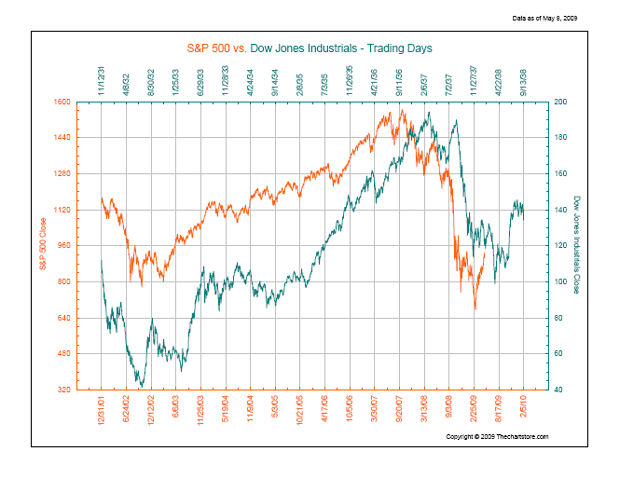
You will remember from our many discussions on the subject that our price managers depend on these faulty pricing mechanisms to aid in supporting the various markets (and resultant inflation) that would otherwise not be possible in terms of a sustainable model and fundamentals, and most of the time they do in fact work quite well. It’s only when speculators are finally exhausted in terms of their logical sensibilities, where for example bad news means bad things for stocks once again because affective put / call ratios finally begin to trend lower, do our sentiment / gambling based market mechanisms fail. This is of course what happened to select stock market(s) last year, and into March for the broads and financials, where when sentiment finally shifts on a more lasting basis due to speculator exhaustion, rapid price adjustments to reflect a more close approximation of reality can quickly erase many years of faulty and fraudulent pricing dynamics in a very short period of time. And for some, who are relying on historical pattern recognition to guide their actions, we should be returning to ‘crash mode’ in stocks presently if the 1929 to 1932 pattern is to remain in tact this time around, with little more room on the upside for stocks if something else is not to develop. Unfortunately for this camp, which includes some very prominent types with very good reasoning attached to their views, they may be premature in terms of a lasting move to continue the secular decline in stocks (equities).
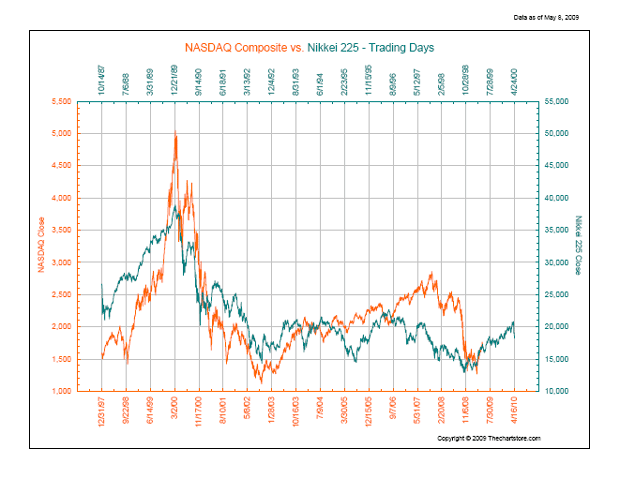
Why would this be the case? Answer: Because the speculators have not capitulated in terms of their bearish views on stocks just yet, which just like everything else associated with this very high degree move (think in terms of Z-Waves), will likely continue to set new precedents in terms of more recent history. (i.e. within the present Super Cycle.) How do we know propensities lie in this direction? Well, for one thing we know that although some measures are beginning to soften, the all important open interest put / call ratios on the major US stock indices have not softened up much despite the record rally(s) in stocks over the past few months, which as you know from our extensive analysis on the subject is suggestive of higher prices in the offing. Now, this doesn’t mean the bulls can’t get their bells rung with a pullback of 5 to 10% as suggested last week, which continues to look likely considering overbought conditions, however if too many get short once it appears an intermediate turn has been made, bearish speculators could be in for a nasty surprise as June options expiry approaches. Here, such an outcome would mirror something closer to the post crash sequences witnessed in 1937 / 1938 and that of the Nikki after declining throughout the 90’s, which are both pictured below. So you see its time for the ‘fat lady to sing’ in terms of which patterning will prevail, making our appraisal of sentiment related conditions very important indeed.
Without a doubt, one important factor in favor of the 1929 pattern dominating the price action moving forward is the fact the small speculators (dumb money) have not capitulated in terms of their bullish views as of last weeks Commitment Of Traders (COT) reports. That’s right, not only have they increasing their long positions on the S&P 500 (SPX) and Nasdaq over the past weeks, they are increasingly going long the Dow now as well, which is bearish, and a trifecta that one must take seriously considering the May options series is expiring this Friday. This will of course leave an overbought stock market vulnerable to a substantial pullback next for the balance of May, and possibly longer (think the 1929 patterning) if sentiment were to remain complacent. And that’s the question you see, what any weakness in stocks during the balance on May does to affect sentiment. If sentiment turns bullish again, as the attached COT reports above suggest, then not only could we have a ‘sell in May and go away’ to September patterning this year, which is the ‘normal’ seasonal pattern, but more, as mentioned in connection with the 1929 patterning, stocks could head straight down for a total loss of 90% off all time highs over the next few years before a bottom is vexed. So again, you can be sure we will be watching how affective sentiment measures progress closely during the balance of the month. And please do not be confused. No matter which scenario prevails moving forward from this point, expect to see a marked increase in volatility post options expiry next week. (See Figure 1)
Figure 1

That is to say, no matter which scenario prevails, that of the 1929 sequence, or the more robust 1938 bear market rally experienced in US stocks pictured above, the one thing both sequences have in common is stocks should head lower soon either way, with the latter outcome still preferred at this point given the tight pattern match, albeit lagged due to timing irregularities associated with our shortened work week these days. Of course some would argue the 1929 patterning still has a chance of prevailing here, and these people would be proven correct if sentiment remains stubbornly bullish moving forward. The only problem with such an outcome in my opinion is human nature causes us to second guess ourselves often in important matters, so I expect to see a resurgence in pessimism with respect to the broad measures of stocks (and notably the financials) after a respite that could last months considering the intensity of the rally sequence these past two months.
Oh, and that’s another thing. While it’s true bear market rallies often flame out in 2 to 3 months, it must be remembered the broads had declined for 17 months into a March low just passed, and it was 24-months for the financials, which would make a lasting to right now appear premature from a psychological dynamics perspective. This was true of the US stock market in 1938, and it was true of the post crash pattern in Japanese stocks as well, where again, while stocks should begin to decline very soon, they would find support not long afterward. (See Figure 2)
Figure 2

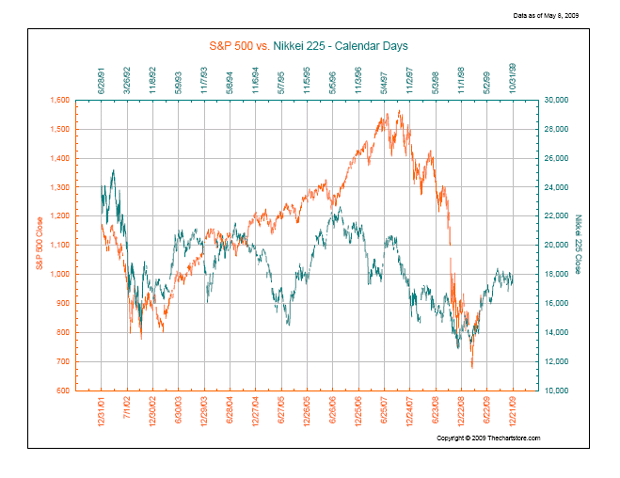
Of course the best pattern match I could find comparing the Nikki’s post crash pattern to present conditions does not allow for much of a pullback at all, which can be seen below, which would confound most traders. Now I am not predicting such an outcome, especially with small speculators so bullish again, however I would be amiss in not showing you this picture considering the pattern match is almost exact. Here, if history is to repeat, then stocks should surge higher into week’s end and then correct, only to be followed by more strength that would run into the fall in a seasonal inversion of a typical annual pattern. Naturally we will need to see small speculators run for the hills with any post options expiry weakness, along with open interest put / call ratios remaining firm, but hey, stranger things have happened, no? (See Figure 3)
So, the bottom line at this point is nobody knows what is most likely to happen in the stock market after next week, however at the same time by the end of next week we will have a good idea of how sentiment should develop moving forward, which will tell the story. Accordingly then, one should play things on the conservative side next week, taking profits on trading positions later this week, looking to possibly reposition at some point when it becomes apparent such move has a better than even chance of being successful. And this stratagem applies to all equities, from tech stocks, to natural gas (NG), which has been discussed at length, to any grain positions you may have on – or in other words all equities that might suffer from a further / prolonged contraction in liquidity.
One should note that since this commentary was published a noticeable change in sentiment has taken place.
Unfortunately we cannot carry on past this point, as the remainder of this analysis is reserved for our subscribers. Of course if the above is the kind of analysis you are looking for this is easily remedied by visiting our continually improved web site to discover more about how our service can help you in not only this regard, but also in achieving your financial goals. For your information, our newly reconstructed site includes such improvements as automated subscriptions, improvements to trend identifying / professionally annotated charts, to the more detailed quote pages exclusively designed for independent investors who like to stay on top of things. Here, in addition to improving our advisory service, our aim is to also provide a resource center, one where you have access to well presented 'key' information concerning the markets we cover.
And if you have any questions, comments, or criticisms regarding the above, please feel free to drop us a line . We very much enjoy hearing from you on these matters.
Good investing all.
By Captain Hook
http://www.treasurechestsinfo.com/
Treasure Chests is a market timing service specializing in value-based position trading in the precious metals and equity markets with an orientation geared to identifying intermediate-term swing trading opportunities. Specific opportunities are identified utilizing a combination of fundamental, technical, and inter-market analysis. This style of investing has proven very successful for wealthy and sophisticated investors, as it reduces risk and enhances returns when the methodology is applied effectively. Those interested in discovering more about how the strategies described above can enhance your wealth should visit our web site at Treasure Chests
Disclaimer: The above is a matter of opinion and is not intended as investment advice. Information and analysis above are derived from sources and utilizing methods believed reliable, but we cannot accept responsibility for any trading losses you may incur as a result of this analysis. Comments within the text should not be construed as specific recommendations to buy or sell securities. Individuals should consult with their broker and personal financial advisors before engaging in any trading activities, as we are not registered brokers or advisors. Certain statements included herein may constitute "forward-looking statements" with the meaning of certain securities legislative measures. Such forward-looking statements involve known and unknown risks, uncertainties and other factors that may cause the actual results, performance or achievements of the above mentioned companies, and / or industry results, to be materially different from any future results, performance or achievements expressed or implied by such forward-looking statements. Do your own due diligence.
Copyright © 2009 treasurechests.info Inc. All rights reserved.
Unless otherwise indicated, all materials on these pages are copyrighted by treasurechests.info Inc. No part of these pages, either text or image may be used for any purpose other than personal use. Therefore, reproduction, modification, storage in a retrieval system or retransmission, in any form or by any means, electronic, mechanical or otherwise, for reasons other than personal use, is strictly prohibited without prior written permission.
Captain Hook Archive |
© 2005-2022 http://www.MarketOracle.co.uk - The Market Oracle is a FREE Daily Financial Markets Analysis & Forecasting online publication.


