


Stock Market Investor Sentiment Intent on Crushing the Bears
Stock-Markets / Stocks Bear Market May 31, 2009 - 12:44 PM GMTBy: Guy_Lerner

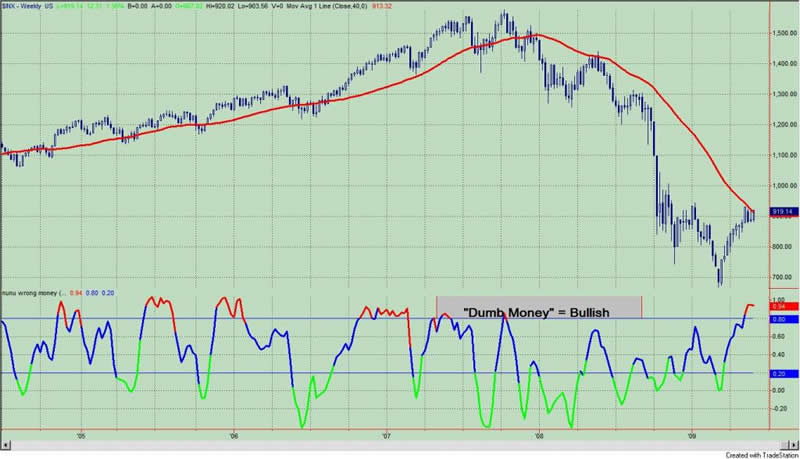
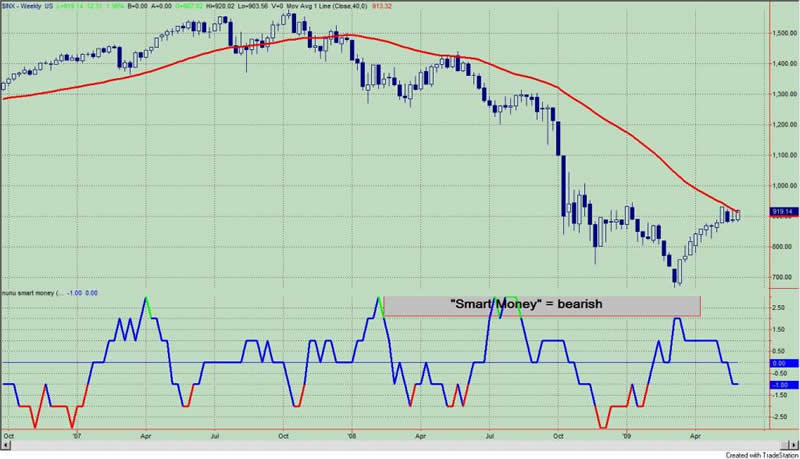
 There is no meaningful difference in the "Dumb Money" and "Smart Money" indicators from last week. The "dumb money" is extremely bullish, and their persistence is being rewarded as the major indices turned in winning performances for the month of May. The "smart money" is bearish but not to an extreme degree.
As I have pointed out over the past couple of weeks, it takes bulls to make a bull market, and I have not completely resolved the issue of new bull market versus bear market rally. My own work suggests bear market rally, but I do acknowledge that the persistence of the bulls is very reminiscent of 1995 or 2003, when sentiment got stuck in the bullish extreme while prices continued higher. As the equity indexes continue in a range, we haven't seen the "much higher" yet to confirm the new bull market scenario. On the other hand, we haven't seen the market break down and confirm the bear market rally scenario. We are stuck in a range, which means lack of resolution.
The "Dumb Money" indicator is shown in figure 1. The "Dumb Money" indicator looks for extremes in the data from 4 different groups of investors who historically have been wrong on the market: 1) Investor Intelligence; 2) Market Vane; 3) American Association of Individual Investors; and 4) the put call ratio.
Figure 1. "Dumb Money"/ weekly
The "Smart Money" indicator is shown in figure 2. The "smart money" indicator is a composite of the following data: 1) public to specialist short ratio; 2) specialist short to total short ratio; 3) SP100 option traders.
Figure 2. "Smart Money"/ weekly
Other sentiment data that I have available to me presents a mixed picture. According to a research report (dated: May 6, 2009) from Insider Score: "Insider Sentiment: "Sales Widespread, Buyers Show No Conviction". Their key findings were as follows:
1) Market-wide sentiment falls to worst levels since February 2007 as sellers cast wider net.
2) S&P 500 sentiment worst since May 2007; Russell 2000 sentiment worst since December 2006.
3) Technology sentiment worst since November 2006.
4) Insiders using post-earnings trading windows to sell; buyers showing little conviction.
5) CEO and CFO sales increase.
The extremes in insider selling and lack of insider buying are not necessarily harbingers of a market top. As the report explains:
"The last time we saw sentiment this bearish was six weeks before the sub-prime implosion and credit crunch hit." On the other hand, "we should also note that extreme levels of selling haven’t always correlated to market tops as you can see in the chart on the previous page. For example, the highest levels of selling in late 2006 were in the midst of the previous “bull run” and occurred well before the market hit its all time highs."
Another sentiment data point, which shows that the intent of the bulls is to crush the bears, comes from the Rydex asset data. Rydex is a family of mutual funds providing intraday trading, leveraged products, and products inverse to the major indices. Think of Rydex funds as fore bearers to the present day menu of ETF's. Everyday, Rydex provides the actual flow of assets into each fund and one can "see" where money is going - that is, where investors are putting their hard earned cash.
One metric I like to look at is the amount of money in the Rydex bearish and bullish leveraged funds. Investors not only are picking a direction (i.e., bull v. bear) but they are doing so with conviction (i.e., using leverage). A graph of the Rydex bullish leveraged (green line) v. bearish leveraged (red line) is shown in figure 3, a daily chart of the QQQQ. Typically, we want to bet against the consensus. So when there are too many bulls using leverage we should be bearish; too many leveraged bears and we should be bullish.
Figure 3. Rydex Leveraged Bulls v. Bears/ daily
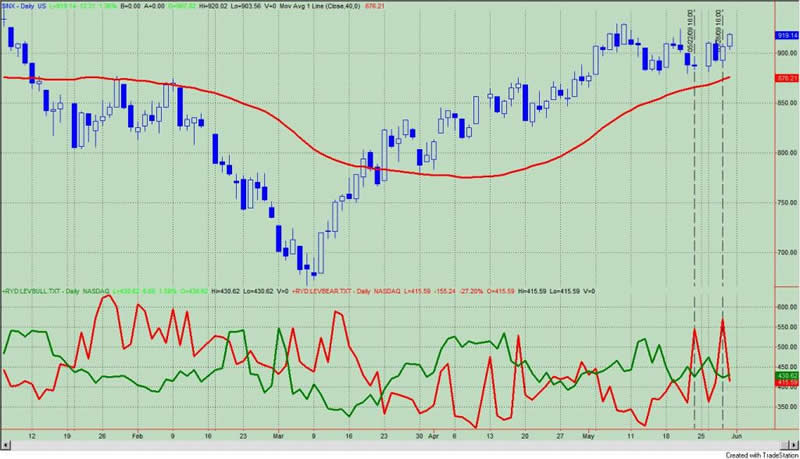
As you can see from the graph, we have had two spikes in the amount of bearish leveraged assets relative to the bullish leveraged assets over the past week. In other words, there were too many leverage bears. The following day prices spiked crushing the bears. The bears are having a difficult time gaining traction. And by extension, one can draw the conclusion that the current rally isn't about true buying demand but the result of short covering.
To summarize, the current price range indicates a lack of resolution. Resolution of the current price range should provide clarity to the following questions: are we in a new bull market or is this a bear market rally? The persistence of the bulls and the lack of bearish traction in the Rydex data is noteworthy. This is the kind of price action that emboldens the bulls and demoralizes the bears and can be self-fulfilling leading to higher prices.
Over the past couple of weeks, I have presented a more bearish scenario that has been at odds with the bullish price action. Within the context of a bear market (which I believe we are still in), excessive bullish sentiment should be interpretated as a reason to expect lower prices. In addition, the trends in inflation sensitive assets are also a significant headwind especially in a bear market. I recognize that I can be wrong; I recognize that my tools may not detect subtle changes in trend. The current bullish price action (or lack of bearish price action) is still within the realm of my studies for me to continue to call the current upswing a bear market rally. Nothing has changed for me to "throw in the towel", but I have discussed, in the May 5th commentary, what would make me change from bear to bull.
By Guy Lerner
http://thetechnicaltakedotcom.blogspot.com/
Guy M. Lerner, MD is the founder of ARL Advisers, LLC and managing partner of ARL Investment Partners, L.P. Dr. Lerner utilizes a research driven approach to determine those factors which lead to sustainable moves in the markets. He has developed many proprietary tools and trading models in his quest to outperform. Over the past four years, Lerner has shared his innovative approach with the readers of RealMoney.com and TheStreet.com as a featured columnist. He has been a regular guest on the Money Man Radio Show, DEX-TV, routinely published in the some of the most widely-read financial publications and has been a marquee speaker at financial seminars around the world.
© 2009 Copyright Guy Lerner - All Rights Reserved
Disclaimer: The above is a matter of opinion provided for general information purposes only and is not intended as investment advice. Information and analysis above are derived from sources and utilising methods believed to be reliable, but we cannot accept responsibility for any losses you may incur as a result of this analysis. Individuals should consult with their personal financial advisors.
Guy Lerner Archive |
© 2005-2022 http://www.MarketOracle.co.uk - The Market Oracle is a FREE Daily Financial Markets Analysis & Forecasting online publication.
Comments
|
Jack
02 Jun 09, 22:22 |
stocks
Worst is over, buy on the dips, but the trend is up |