


Manipulated Government GDP Statistics Report is Just Plain Wrong
Stock-Markets / Market Manipulation Aug 01, 2009 - 01:11 AM GMTBy: Dr_Martenson

 The GDP report was released Friday (7/31/09) and it was a compendium of incomprehensible and illogical numbers and, worse, it is just plain wrong.
Of course, since so much rides on an accurate assessment of our true economic state of affairs it behooves us to make sense of it as best we can understanding that the GDP report is less than perfect and riddled with difficult-to-rationalize statistical manipulations and quirky additions.
For example, the imputed value of "owner occupied housing" is a non-cash 'addition' to GDP meant to capture the value that people derive from their houses due to the fact that they own them and do not pay rent to themselves in order to live there. If this does not make sense to you that means you are normal.
So we gamely march off into the most current GDP report which came out this morning (Friday, July 31, 2009) mostly to expose just how wrong it is.
First, I want to reveal how I look at data. It comes in three buckets for me. In my most recent Martenson Report I divided data (or facts) into three buckets: good, murky, and unreliable.
Into the good bucket I put all sources of data fitting the following important criteria: The data itself is not statistically massaged before release, it is not 'sampled' but rather tallied up in its entirety, and it squares up nicely with other good sources of data.
Good Data
- Sales tax data
- Income tax data
- Truck tonnage moved
- Port shipping container traffic
- Air transport
- UPS, FedEx, and other major shippers' volume
- Corporate Revenues
Into a bucket of lesser importance goes the murky data. This data is based on sampling, usually conducted by self-interested parties (National Association of Realtors data for example), or is seasonally or statistically adjusted, and/or does not square up with other, better data.
Murky Data
- NAR home sales data
- Continuing claims
- Retail sales data
- Trade deficit reports
- Corporate Income
Into the final bucket goes the utterly unreliable 'data,' so bad that I need to use quotes around it. This 'data' is modeled or otherwise manufactured out of thin air with no accountability, does not square up (at all) with good sources of data, has massive errors in methodology that have never been explained, consists of survey data for reasons covered in an earlier Martenson Report (Survey Says...), is self-referential (e.g. LEI or 'leading indicator' data), and/or has been proven repeatedly in the past to be consistently biased for political or self-serving gain.
Unreliable Data
- New home sales data
- Employment data (due to the Birth-Death model)
- All survey data
- Leading indicator data
- GDP
Because of the hedonics and imputed adjustments I consider the GDP report to be among the most unreliable sources of data.
But I place corporate revenues into the "good" bucket because, unlike corporate earnings (in the murky bucket), there are many fewer games and shenanigans that can be played with revenue.
Apart from sliding revenue forwards and backwards a quarter or two, revenue is relatively pure data. GAAP accounting assures as much.
Added up across all companies, revenue provides a nice, clean picture of where things are going. Perhaps the best we have.
Here's the most recent picture of that (found here):
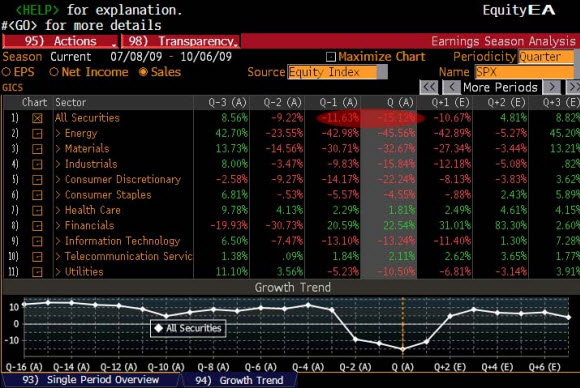
What we see here is that for ALL companies in the S&P 500, a comprehensive enough sample that we can use this as a reliable measure of revenue across the entire corporate landscape, we find that revenues are down more than -15% in Q2 2009 compared to 2Q 2008.
Now, if you think about it, when people buy (or consume) anything, that transaction passes through a company somewhere, somehow. Which means it will show up in some company's revenue. So we might use this -15% decline in corporate revenue as a pretty good approximation for how much less stuff is being consumed this year compared to last year.
OK - now let's look at the GDP report.
I am going to avoid all of the massive complexity that normally accompanies discussions of the GDP report and go for the simplest possible illustration of just how spectacularly off-base and misleading it is.
On television, and from a raft of well-meaning experts, you will hear explanations for why this GDP report makes sense and they will trot out things like an increase in government expenditures, falling imports, inventory builds and all the rest. But we can skip all that and simply look at one thing.
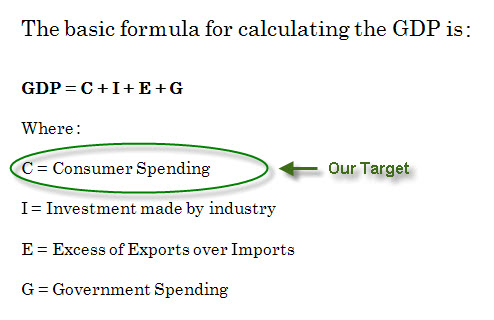
All I want to focus on is just one component, circled in green above, consumer spending which represents over 70% of the economy. Given this prominence, and taking our argument that there must be some proportional relationship between consumer spending and corporate revenues, we need look no further than this one simple measure to determine that something is seriously out of whack in the GDP report.
From today's GDP release, we get these numbers for the total GDP and something called "PCE" which stands for Personal Consumption Expenditures (i.e. "Consumer Spending" in the formula above):
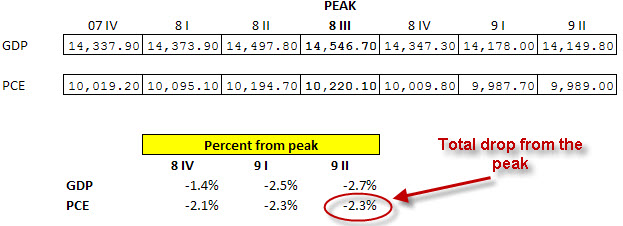
Going from the very peak of the economy in QIII of 08, we can see that the BEA reports that GDP and PCE have only dropped by 2.7% and 2.3%, respectively.
Really?
PCE is only down -2.3% from peak? With corporate revenues in total down more than 15%? How does that work?
Is there some way to explain how people are consuming away but doing so without spending money on products and services offered by companies? How do we explain a 15% drop in the solid, reliable corporate revenue numbers but a 2.3% drop in Personal Consumption Expenditures?
I really can't think of any possible explanation that makes sense and so I have to defer to the more reliable and trustworthy of the two numbers; corporate revenues.
Of course, comparing from the peak to current is not exactly what we should be doing because that is comparing a QIII to QII drop in PCE to a QII to QII drop in corporate revenues.
When we ask the question, "How much have GDP and PCE dropped between QII 08 and QII 09?" we get these results:

Well, there, that certainly makes me feel better!
Just kidding.
This means we are being asked by the Bureau of Economic Analysis (BEA) to accept a reported -2% drop in PCE and a decline in corporate revenue of -15% , a figure more than seven times larger.
Of course, the discrepancy between the two cannot be reconciled. It is impossible. One must accept one or the other.
I will point out that a -15% decline in corporate revenues is also in alignment with sales tax data from the states (down some 10% yr/yr), unemployment (9.5% and climbing) and many other economic measures. I will recall here that good data is that which aligns with other data.
How is such a misleading GDP report created? (hint: think sausages)
The answer lies in a disturbing mixture of seasonal and hedonic adjustments, imputations and other statistical wizardry not subject to review or insight. We are asked to simply accept the results without question. Disturbingly, the Wall Street/MSM (Main Stream Media) spin-machine runs off with the GDP report as though it were the sacred truth itself as we can see in this series of headlines I captured off of Google shortly after the release.
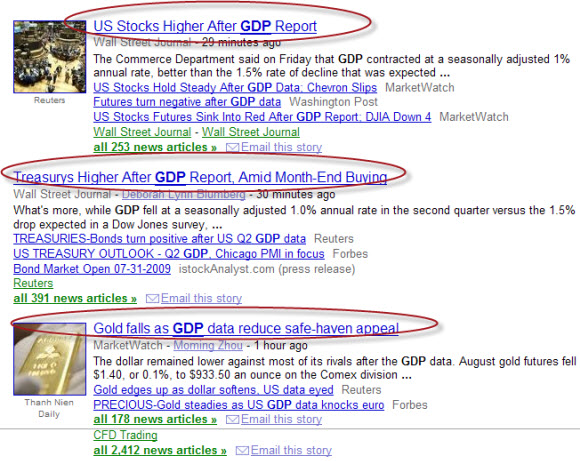
The triple combination of stocks up(!), bonds up(!) and gold down(!) constitutes a "win-win-win" for government statisticians/politicians and the Federal Reserve because such a result means that their efforts are being taken "the right way" by the markets.
Such a trifecta constitutes a vote of confidence in their suite of actions generally and in paper wealth specifically.
Of course, curious minds might be interested to learn how such articles manage to come out within mere minutes of the GDP release, almost as if they were pre-written.
If they are (as many suspect), then this implies that the "market responses" as well were already known in advance implying that they are as fake as the report itself.
In the scheme of things, one might question whether a country that routinely lies to itself, and then accepts those lies, then reprints those lies, and ignores the obvious discrepancies is really on a sustainable path to recovery, complete with green shoots, or whether it is merely leading itself astray.
But if one is like me, then no wondering is involved. Such self-deception is viewed as a prescription for failure.
By Dr. Chris Martenson
http://chrismartenson.com/
Copyright © 2009 Dr Chris Martenson
Dr Martenson is the creator of The End of Money economic seminar series, has extensive experience analyzing and communicating financial information. Dr. Martenson combines a scientist's attention to fact and analysis (PhD, Duke University, Pathology and Toxicology) with a solid understanding of finance and economics (MBA, Cornell, Finance) with strategic thinking (4 years as a management consultant) to produce an insightful and powerful lecture. He is currently devoted to researching, writing and presenting economic and financial analyses delivering his message via his website, lecture series and is currently working on a related book & movie.
Dr. Chris Martenson Archive |
© 2005-2022 http://www.MarketOracle.co.uk - The Market Oracle is a FREE Daily Financial Markets Analysis & Forecasting online publication.