


Stock Market 6 Month Counter Trend Rally Ending
Stock-Markets / Stocks Bear Market Aug 30, 2009 - 10:02 PM GMTBy: Andre_Gratian

 Current Position of the Market
SPX: Long-term trend - Down! The very-long-term cycles have taken over and if they make their lows when expected, the bear market which started in October 2007 should continue until 2014. This would imply that much lower prices lie ahead. This will not be a straight-down decline, but a series of intermediate-term rallies and declines until we have reached the low point.
SPX: Intermediate trend - reversing! The counter-trend rally which started in March is now coming to an end. The price objective for a high is being reached and, to deceleration we have now added negative divergence. But we cannot call a top until we have a confirmed reversal.
Analysis of the short-term trend is done on a daily basis with the help of hourly charts. It is an important adjunct to the analysis of daily and weekly charts which determines the course of longer market trends.
Daily market analysis of the short term trend is reserved for subscribers. If you would like to sign up for a FREE 4-week trial period of daily comments, please let me know at ajg@cybertrails.com .
Overview:
For the past month, I have been saying that when the SPX reached 1018, it had essentially reached its target and that we could expect a correction. I see no reason to change my mind. When the retracement to 980 ended and the index pushed higher, I gave an extended target of 1037 which was reached last Tuesday and followed by a pull-back. On Friday came another push to 1039 which could not be sustained and the index sold off, closing slightly down for the day.
Since the SPX touched 1018, technical conditions have deteriorated further, and when the index went to the 1037 new high, strong negative divergence was created both in the momentum and breadth indicators. On Friday, these indicators may have given a sell signal at the close. If so, we should open down on Monday. As we will see when we look at the charts, there is a trend line which will decide this. If it holds, we could still see slightly higher prices.
When it reached 1018 and later, at 1037-39, the SPX was pushed back by the trend line which forms the upper portion of its wedge pattern. To change the increasingly negative picture, the index would need to break above this trend line on increasing volume and positive breadth, and it would need to do it quickly. We will soon be in September which is rated, on average, as the most negative month of the year for the stock market, and the deteriorating technical picture is not giving us any reason to expect anything different this year. Still, until we get a confirmed sell signal, we cannot say that a top has been made. Friday's action -- a spike higher which cannot be sustained after a long run -- came close to giving a classic sell signal. Had there been more weakness into the close, it would have been more convincing.
Let's now dissect the technical picture and look at charts.
What's ahead?
Chart Pattern and Momentum
The weekly chart clearly shows that the wedge pattern remains intact. The bottom indicator remains severely overbought, and some negative divergence is creeping in the top one. Note also that prices had a very short range and we closed in the middle of that range. No follow-through to the previous week's strong attempt at moving above the overhead resistance is a bearish sign. If we trade below last week's low, it should trigger a sell signal.
The entire pattern from 667 leaves little doubt that we are making a corrective wave. It may have come to an end last week if the small "c" wave was completed. It would also complete the larger "C". If this is the case, we could start breaking some trend lines as early as Monday and challenge the entire wedge pattern.
There are several wave interpretations of the entire move from 667 -- and from the top as well, for that matter. Since giving it a label would only be a guess on my part, I'll pass and leave it to the experts.
The daily chart (below) shows how the index created a (red) resistance line, which became the top of a wedge pattern.
The indicators show how weak the last attempt at moving up was. This is when they developed the negative divergence which suggests that the SPX does not have the strength to go through the trend line, and that it will be pushed back.
Note the similarity of the "A" and "C" segments. "C" appears to be a small replica of "A". In particular, notice the similarity between the top which formed at "A", and the potential top which is forming at "C". Unless something changes quickly, that segment will suffer the same fate. The change would have to come in the form of strength which takes the index through the red line, and it would have to come right away. If the first green trend line is broken, there is a good possibility that the index will go on to challenge the bottom line of the wedge and the former low of 979.
Even though the entire rally from March is deemed to be a bear market rally, it has shown unusual strength and there are plenty of trend lines, moving averages, and support levels which will have to be overcome to get a full-fledged decline going.
The final confirmation that we may have started a serious decline will be when we break through the bottom trend line of the wedge pattern, currently around 960.
The hourly chart, below, illustrates the precarious position of the SPX at the close of Friday's trading. Somehow, the index managed to stay above the short-term trend line after failing to overcome the former high. It also found support above its moving averages.
I have a question mark next to the "C" label, because it is difficult to tell, at this point if the move is complete, or if there is more to go. Only after it starts breaking some trend lines and former support will the SPX tell us that it has reversed. The crawling pattern on the short-term trend line -- instead of pushing away from it -- is a sign of weakness, but it could just as soon find some renewed strength on Monday morning and push away from it than break to the downside. There was a minor cycle which bottomed near the close which is probably responsible for the holding pattern. Not only do we need to break the black trend line, but the green one as well in order to give a sell signal and suggest that the C wave has come to an end.
Cycles
Longer-term cycles had been expected to top in early August. The fact that the index closed Friday 8/28 only 12 points higher than its 8/7 high is a testimonial to the pressure which they are slowly applying to the longerterm trend. Considering the rash of good economic news which has been published during the month of August, this is not much of a gain. And since this pressure is likely to increase as we go forward, it would seem inevitable that we are near the end of the move which started in March, at 667. Furthermore, these cycles are not expected to bottom until we are well into 2010, perhaps in conjunction with the next 4-year cycle low.
Of more immediate concern, the 13-day cycle is due to make its low on 8/4. This is one reason why the SPX may find it difficult to extend its upside progress at this time.
Projections:
The 1037 projection has been reached, and you might say tested successfully, on Friday when the SPX went to 1039 but was pushed back immediately.
If it should find the strength to make another run to the upside, 1046-1048 would be the next target.
Downside targets will be given to subscribers when the top has been confirmed.
Breadth
The McClellan summation index below (courtesy of StockCharts) is an excellent gauge of the intermediate condition of the stock market. You can see that the index has been making a pattern of deceleration and divergence over the past 3 weeks. It is still overbought, and on Friday appeared to start rolling over. This is in accordance with the picture given by the price pattern and indicates that weakness is just around the corner.
The daily breadth readings are showing negative divergence relative to price as well.
In his latest "Technical Report", Mike Burke mentions that new 52-wk highs have not been keeping up with the indices in the past few weeks. It is the same picture that we have in the NYSI. This is intermediate-term bearish.
Market Leaders and Sentiment
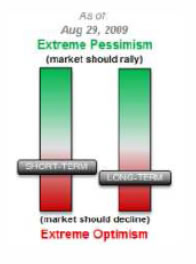
The sentiment indicator (courtesy of Sentimentrader) is not at an extreme, and I am not sure if this means that the sentiment needs to get more negative before we can end the rally. The indicator reflects the ambiguity associated with the market position as to whether we have seen the high, or we do not yet have a firm top in place.
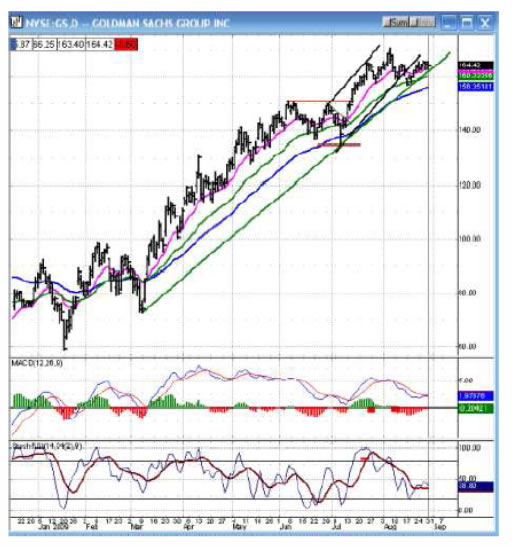
Goldman Sachs has been a market leader. However, it has not led to the upside since the SPX made its high of 1018 and, if viewed as an indicator, it also reflects negative divergence. But as you can see on the daily chart below, it has not broken its trend line. One can assume that when it does, it will give a sell signal, and so will the market.
Summary
As they turn down, the longer-term cycles are slowly applying pressure to the stock market indices. Improving economic conditions have bolstered the averages, but we appear to be at the end of that process as price deceleration is becoming evident and negative divergence is appearing in all technical indicators. This suggests that the end of the rally from the March low is imminent. However, there is some ambiguity about the short term and we cannot make a definite statement until we have broken a trend line.
When it gets underway, the decline is expected to continue well into 2010.
The following are examples of unsolicited subscriber comments:
Awesome calls on the market lately. Thank you. D M
Your daily updates have taken my trading to the next level. D
… your service has been invaluable! It's like having a good technical analyst helping me in my trading. SH
I appreciate your spot on work more than you know! M
But don't take their word for it! Find out for yourself with a FREE 4-week trial. Send an email to ajg@cybertrails.com .
By Andre Gratian
MarketTurningPoints.com
A market advisory service should be evaluated on the basis of its forecasting accuracy and cost. At $25.00 per month, this service is probably the best all-around value. Two areas of analysis that are unmatched anywhere else -- cycles (from 2.5-wk to 18-years and longer) and accurate, coordinated Point & Figure and Fibonacci projections -- are combined with other methodologies to bring you weekly reports and frequent daily updates.
“By the Law of Periodical Repetition, everything which has happened once must happen again, and again, and again -- and not capriciously, but at regular periods, and each thing in its own period, not another’s, and each obeying its own law … The same Nature which delights in periodical repetition in the sky is the Nature which orders the affairs of the earth. Let us not underrate the value of that hint.” -- Mark Twain
You may also want to visit the Market Turning Points website to familiarize yourself with my philosophy and strategy.www.marketurningpoints.com
Disclaimer - The above comments about the financial markets are based purely on what I consider to be sound technical analysis principles uncompromised by fundamental considerations. They represent my own opinion and are not meant to be construed as trading or investment advice, but are offered as an analytical point of view which might be of interest to those who follow stock market cycles and technical analysis.
Andre Gratian Archive |
© 2005-2022 http://www.MarketOracle.co.uk - The Market Oracle is a FREE Daily Financial Markets Analysis & Forecasting online publication.