


Stock Market Counter Trend Rally Near Reversing, Awaiting Top Confirmation
Stock-Markets / Stocks Bear Market Sep 13, 2009 - 06:28 PM GMTBy: Andre_Gratian

 Current Position of the Market
SPX: Long-term trend - Down! The very-long-term cycles have taken over and if they make their lows when expected, the bear market which started in October 2007 should continue until 2014. This would imply that much lower prices lie ahead. This will not be a straight-down decline, but a series of intermediate-term rallies and declines until we have reached the low point.
SPX: Intermediate trend - near reversing! The counter-trend rally which started in March is soon coming to an end. The price objective for a high is being reached and, to deceleration, we have now added negative divergence. But we cannot call a top until we have a confirmed reversal.
Analysis of the short-term trend is done on a daily basis with the help of hourly charts. It is an important adjunct to the analysis of daily and weekly charts which determines the course of longer market trends.
Daily market analysis of the short term trend is reserved for subscribers. If you would like to sign up for a FREE 4-week trial period of daily comments, please let me know at ajg@cybertrails.com .
Overview:
Some cycle analysts had expected the longer-term cycles to roll over as early as the beginning of August, while some held out for the end of September/early October. They may turn out to be correct in spite of the overwhelming tendency of the month of September to be the weakest month of the year!
After reaching our projection of 1037 on 8/25, the SPX briefly pulled-back and made a double-top at 1039. This was followed by a correction to the 992 support level, where a Point & Figure base was created giving a count of 1045. When it broke out to the upside on 9/3, the index marched straight to 1048, reached it last Friday morning, and immediately pulled back 10 points breaking its uptrend line and finding support on its channel line. It spent the rest of the day crawling back up under its broken trend line, but inside its channel line -- which is still intact -- and closed slightly down for the day.
When it looked apparent that the SPX was going to make a new high, I gave my subscribers 1045 as the minimum projection for the new wave, and 1061 as the maximum. The first target is a Point & Figure projection. The second uses Fibonacci.
As we will see when we look at the charts, the first target was reached last week with a number of indicators showing negative divergence on the hourly and daily charts, and this should at least bring about a correction. But there was so much momentum in the move from 992, that 1048 is unlikely to be the final high.
Let's look at the charts!
What's ahead?
Chart Pattern and Momentum
Although it made a new high last week, the Weekly chart of the SPX is still in an ascending wedge pattern, with the same ramifications. Unless the pattern evolves into something else, the trend is deemed to finish with a resumption of the downtrend.
A sell signal will be given when the index breaks the bottom of the wedge (green trend line) and closes below 979. The oscillators suggest that this may not be not too far away.
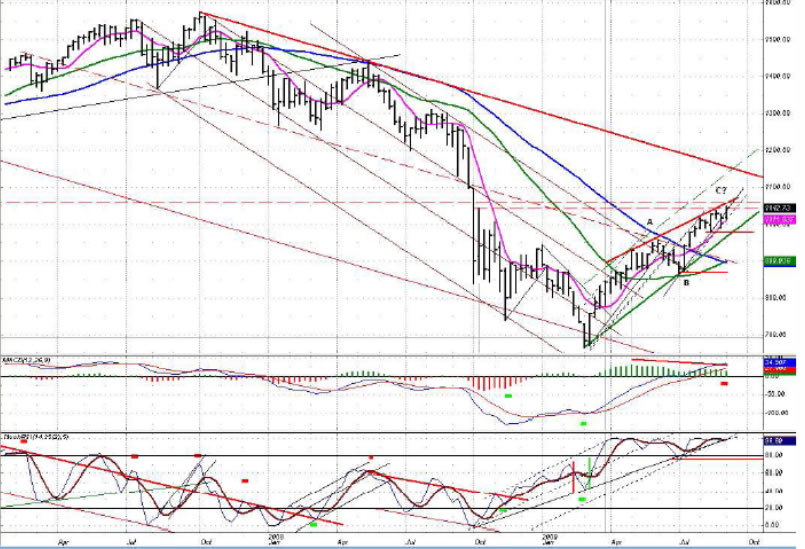
The Daily chart (below) shows that negative divergence has established itself in the momentum indicators, but the A/D oscillator is telling us that the coming correction should be only that: a correction, and not the end of the entire rally.
The index has reached resistance derived from several sources and at the same time filled an important P&F target at 1045. Considering the market condition, a correction is probable before we go and fetch the high of the move.
The negative divergence is becoming more and more noticeable in the MACD. A preliminary sell signal will be given when the (main) green trend line is broken.
The Hourly chart (above) shows even more clearly that the rally which started at 992 is ready for a correction. The A/D is in a downtrend and in negative territory while the momentum oscillators are just getting started on the downside.
On Friday, the index went a little beyond its 1045 target, but sold off immediately breaking its uptrend line. It did not follow through but rallied into the close, remaining negative for the day. Its current position suggests that it has either already started a correction, or is about to.
Cycles
The longer-term cycles which had been expected to roll over in early August have been delayed, helped by a rash of good economic reports. Nevertheless, it's only a matter of time before they turn. Perhaps another two or three weeks.
There is a very minor cycle due on the 15th then two small cycles due the 22nd and the 23rd.
Projections:
As soon as the SPX reversed at 992, I saw the possibility of new highs and gave a couple of projections. One, the Point & Figure base that was made over a period of three days, gave a count of 2045 which was slightly exceeded last Friday. The other gave a Fibonacci target of 1061. Since the first target was reached so early and with so much strength in the move, I have to assume that, after a correction, the index is going to try for the other one.
On the downside, there is a potential P&F target to about 1030. Let's also keep in mind that there is a gap between 1016 and 1020.
Breadth
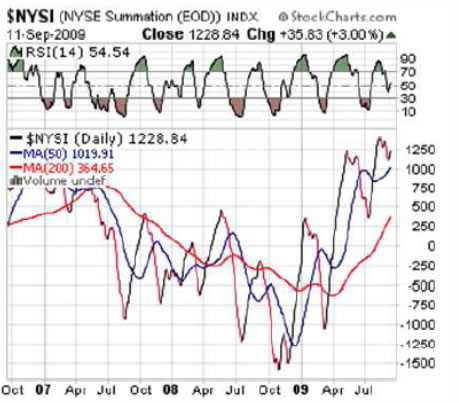
The McClellan Summation Index (courtesy StockCharts) is now showing severe divergence with the price. While the SPX went higher in the past week, the SI remained well below its previous high. The same intensive divergence is showing on the daily and hourly A/D charts.
In his latest "Technical Report", Mike Burke points out that the rally of the past week has developed "with no leadership, no volume, and no new highs". Those are hardly good "technicals" to support a rally!
Market Leaders and Sentiment
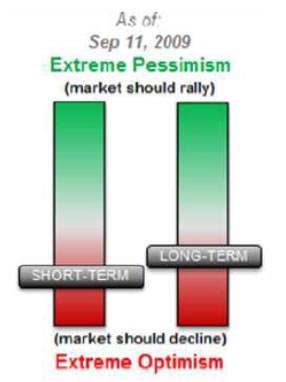
The sentiment indicator (courtesy of Sentimentrader) is not yet at a point where it is vulnerable to a long term decline, but the short term is sufficiently oversold to complement the pattern of the hourly indicators which call for a short-term decline.
GS has also made a new high, nullifying the relative weakness it had to the market. This probably also forestalls an important reversal at this time.
Summary
When it gets underway, the decline is expected to continue well into 2010. We are not quite there yet, but I would expect that by the next newsletter, things will look a little different -- and we will be much closer to reversing!
The following are examples of unsolicited subscriber comments:
Awesome calls on the market lately. Thank you. D M
Your daily updates have taken my trading to the next level. D
… your service has been invaluable! It's like having a good technical analyst helping me in my trading. SH
I appreciate your spot on work more than you know! M
But don't take their word for it! Find out for yourself with a FREE 4-week trial. Send an email to ajg@cybertrails.com .
By Andre Gratian
MarketTurningPoints.com
A market advisory service should be evaluated on the basis of its forecasting accuracy and cost. At $25.00 per month, this service is probably the best all-around value. Two areas of analysis that are unmatched anywhere else -- cycles (from 2.5-wk to 18-years and longer) and accurate, coordinated Point & Figure and Fibonacci projections -- are combined with other methodologies to bring you weekly reports and frequent daily updates.
“By the Law of Periodical Repetition, everything which has happened once must happen again, and again, and again -- and not capriciously, but at regular periods, and each thing in its own period, not another’s, and each obeying its own law … The same Nature which delights in periodical repetition in the sky is the Nature which orders the affairs of the earth. Let us not underrate the value of that hint.” -- Mark Twain
You may also want to visit the Market Turning Points website to familiarize yourself with my philosophy and strategy.www.marketurningpoints.com
Disclaimer - The above comments about the financial markets are based purely on what I consider to be sound technical analysis principles uncompromised by fundamental considerations. They represent my own opinion and are not meant to be construed as trading or investment advice, but are offered as an analytical point of view which might be of interest to those who follow stock market cycles and technical analysis.
Andre Gratian Archive |
© 2005-2022 http://www.MarketOracle.co.uk - The Market Oracle is a FREE Daily Financial Markets Analysis & Forecasting online publication.