Stock Market Rally in 6th Inning or Top of the 12th?
Stock-Markets / Stocks Bear Market Sep 17, 2009 - 04:53 PM GMTBy: Mike_Shedlock
 Without a doubt, the strength and duration of the rally from the March low has surprised many people, me included. Inquiring minds are wondering "Is there still 1/3 more to come?"
Barry Ritholtz makes the case the Rally May Only Be in 6th or 7th Inning.
Noted bear Barry Ritholtz of Fusion IQ has been bullish on the market since March. Stocks have clawed their way back above 1,000 for the S&P 500 and the question remains: How much more to go?
"There's nothing in the technicals that we look at that tell us we're done," says Ritholtz, who authors the popular blog, The Big Picture. "Based on history, which is no guarantee, we could be in the sixth or seventh inning of this rally, which means there still could be a ways to go."
But there are caveats including stubbornly cautious investor sentiment. Let's face it: A lot of us are on the sidelines (in cash), waiting for a shoe to drop.Two Sides To The Coin
Actually it's somewhat of a mistake to call Ritholtz a "noted bear" given that he is not perpetually bearish. He is a trader willing to play on both sides of the fence. Moreover, Ritholtz is certainly correct that there are many chart patterns that technically look good.
However, the opinion that the market can and will continue to rise is becoming ever more widespread, and ironically the bulls ALL say the same thing, namely "everybody else is bearish".
Mutual fund (MuFu) managers are not bearish, that much is certain. At 4.2%, the the MuFu cash-to-assets ratio is one of the lowest in history, in fact lower than at the 2000 top, and only a hair above the 2007 low. Those stats (from a friend) are from July. Given the continued rally, MuFu cash on hand has probably decreased even more in August.
The Dow's dividend yield is now at the level of the the 1968 top and the September 1929 top. Good luck with that!
Even if the bearish case suffers from residual skepticism and a few 'underinvested' hedge funds, it can not be said that the bullish case rests on any solid ground either. The rally is based on the fumes of massive money printing, not just in the US, but China, the UK, and practically everywhere else as well.
Still, as Ritholtz suggests, the S&P (SPY), DOW ($DJX) chart formations, and many other chart formations actually look bullish. Incidentally, the DOW looked bullish in the first half of 1930 as well, and the chart formation looks very similar.
Ritholtz also talks about "air pockets". Indeed the market dropped so fast in 2008 that there have not been that may key resistance levels to overcome. Once resistance is broken through, the market has blasted higher.
However, the flip side of the coin is this market has advanced so far, so fast that if downside momentum does develop, there is nothing but air pockets below. Air pockets are thus a two-way street. If anything, there is far more air below than above.
For a clue as to fundamentals let's take a look at bank lending.
US credit shrinks at Great Depression rate
Please consider US credit shrinks at Great Depression rate prompting fears of double-dip recession.
Professor Tim Congdon from International Monetary Research said US bank loans have fallen at an annual pace of almost 14pc in the three months to August (from $7,147bn to $6,886bn).
"There has been nothing like this in the USA since the 1930s," he said. "The rapid destruction of money balances is madness."
Similar concerns have been raised by David Rosenberg, chief strategist at Gluskin Sheff, who said that over the four weeks up to August 24, bank credit shrank at an "epic" 9pc annual pace, the M2 money supply shrank at 12.2pc and M1 shrank at 6.5pc.
"For the first time in the post-WW2 [Second World War] era, we have deflation in credit, wages and rents and, from our lens, this is a toxic brew," he said.
Mr Congdon said a key reason for credit contraction is pressure on banks to raise their capital ratios. While this is well-advised in boom times, it makes matters worse in a downturn.
"The current drive to make banks less leveraged and safer is having the perverse consequence of destroying money balances," he said. "It strengthens the deflationary forces in the world economy. That increases the risks of a double-dip recession in 2010."Why Did The Federal Reserve Allow This?
Please note the thought "It is unclear why the US Federal Reserve has allowed this to occur."
The answer is easy. The Fed is NOT in control, it never was, and it never will be. The Fed can print money but it cannot force banks to lend.
The statement is further evidence that Belief In Wizards Runs Deep.
Here is an excerpt in which Bill Bonner gets right to the essence of the deflation debate:
Anything could happen. But generally, government stimulus only works when it is not needed. That is, it only works when it goes in the same direction as the underlying trend…not against it.
But now, the underlying trend has reversed. It’s no longer a credit expansion; it’s a credit contraction. The consumer has had his fill of debt. He’s cutting back on his spending and paying off debt. That’s what the July figures show. That’s been the history of entire downturn. That’s why it’s a depression, not a recession. It’s a major change of direction that will take years to accomplish. Now, stimulus is not only useless – since it is against the major trend – its counterproductive. It delays and contradicts the adjustments that need to be made.
Encouraging people to buy too much was what caused the problem in the first place. Encouraging them to buy more now is not a solution; it’s just a continuation of the same flawed policy of stimulating consumer demand…a policy that has been in place for decades.
But now the wind is blowing in the other direction. The government may not like it, but they can’t stop it.Bank Lending Summary
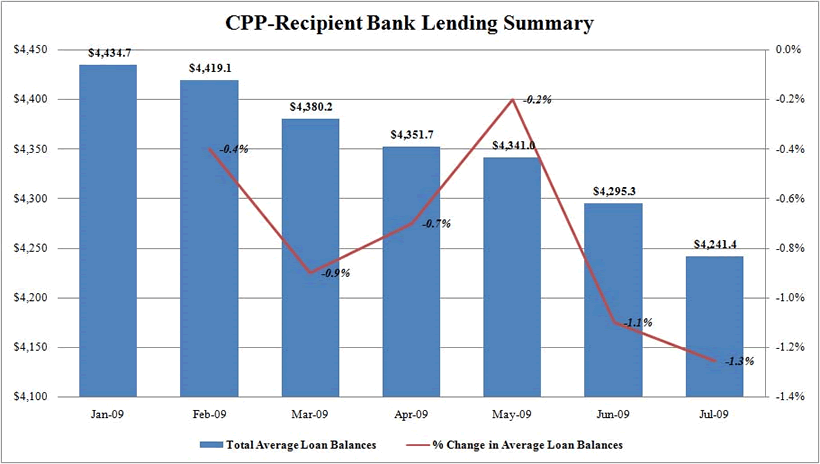
Here is a chart Ritholtz posted in Bank Lending Continues to Slip.
Ritholtz writes: Via Zero Hedge and Naked Capitalism, we see that bank lending is still heading in the wrong direction: Downwards. It's hard to see how a credit dependent economy can grow as credit contracts.
I commend Ritholtz for looking at both sides of the coin. Still, it is important to separate the stock market from the economy. There is a clear disconnect here and Ritholtz would agree.
Bank Lending Drops Sixth Consecutive Month
In Bailout Recipient Banks Lending Drops For Sixth Consecutive Month Zero Hedge writes:
It was just yesterday that Tim Geithner was lying that banks are constantly increasing lending to consumers. Well, yet another lie refuted. Banks, and not just any banks, but those receiving government bail outs and subsidies, continued constricting lending in July, with total average loan balance outstanding declining by $54 billion from $4,295 billion to $4,241 billion, a 1.3% decline, following a 1.1% decline in June.
As for the reason why loan originations in July declined a whopping 10% after posting a 12.7% increase in June, the government simply noted that this was due to "decreased demand from borrowers."
And so the circular lie continues: the government claims lending is increasing, when in fact, it is not, and when confronted with this fact, the government claims this is due to lack of interest.The Senseless Recovery
The ever-practical Mr. Practical is talking about The Senseless Recovery.
Real GDP may be positive for the quarter, but when the government is involved there are lots of shenanigans.
For example, we've heard it plans to deduct the cash rebate for cars from the sales price, thus lowering the GDP deflator and artificially raising the reported real GDP number.
Senseless.
I've written in detail why inflation (credit expansion) is unlikely: The fractional banking system is still broken, and so is the consumer. Without either or both, every dollar the Federal Reserve attempts to print just replaces a dollar destroyed by bad debt.
I estimate another $10 trillion to $20 trillion in debt/derivatives is still bad. The government is resurrecting PPIP to try to make that debt look better.
When the market realizes that the Fed can't create inflation (a full monetization of the majority of debt; something that would make even Ben blink), it'll see that the S&P 500 is really trading at 20 times earnings that are not growing.
It'll realize that all we've done is actually increase the overall debt in the system with massive stimulus and spending.
It'll see the risk in stocks as extremely high.There's more in the article so please give it a longer look.
The key take away from this is that economic fundamentals are very poor, yet no one knows what inning we are really in.
The key word in the concept the Rally May Only Be in 6th or 7th Inning, is "May". I spoke with Barry Ritholtz this morning. He also agrees it's also possible this rally is in the top of the 12th, overtime.
No one knows for sure. For nimble traders, the difference is moot. For those in buy and hold rather than rental mode, the difference is huge.
Please manage your risk accordingly.
By Mike "Mish" Shedlock
http://globaleconomicanalysis.blogspot.com
Click Here To Scroll Thru My Recent Post List
Mike Shedlock / Mish is a registered investment advisor representative for SitkaPacific Capital Management . Sitka Pacific is an asset management firm whose goal is strong performance and low volatility, regardless of market direction.
Visit Sitka Pacific's Account Management Page to learn more about wealth management and capital preservation strategies of Sitka Pacific.
I do weekly podcasts every Thursday on HoweStreet and a brief 7 minute segment on Saturday on CKNW AM 980 in Vancouver.
When not writing about stocks or the economy I spends a great deal of time on photography and in the garden. I have over 80 magazine and book cover credits. Some of my Wisconsin and gardening images can be seen at MichaelShedlock.com .
© 2009 Mike Shedlock, All Rights Reserved
Mike Shedlock Archive |
© 2005-2022 http://www.MarketOracle.co.uk - The Market Oracle is a FREE Daily Financial Markets Analysis & Forecasting online publication.


